
Count Dominance
A look at MLB DW's "Count Dominance" stat. Who to buy, who to sell for 2026.


In the middle of last season, I put a new stat on the main Tableau dashboard called “Count Dominance”. A subscriber tipped me off to the idea, and I thought it was interesting so I ran with it.
What this stat does is look at the rates at which a pitcher works to 0-2 counts and the rate at which they work to 3-0 counts. You can find both of those rates and subtract them to get a K%-BB%-like figure. It will be a bit more granular, and it will highlight some interesting pitchers to look at. It will look at some guys who might have over-performed or under-performed in K-BB%.
I don’t believe this stat should supplant K-BB%. It shouldn’t change our process at all. But it’s interesting to see, and it does make clear some quirks in seasons that we’ll see below.
Let’s lay the groundwork first. The league average on this metric last year was 17%. About 21% of plate appearances go to an 0-2 count, and only 4% go to 3-0. Subtract four from 21, and you get your 17%.
Only nine pitchers managed a mark above 25% last year while throwing at least 1,000 pitches.
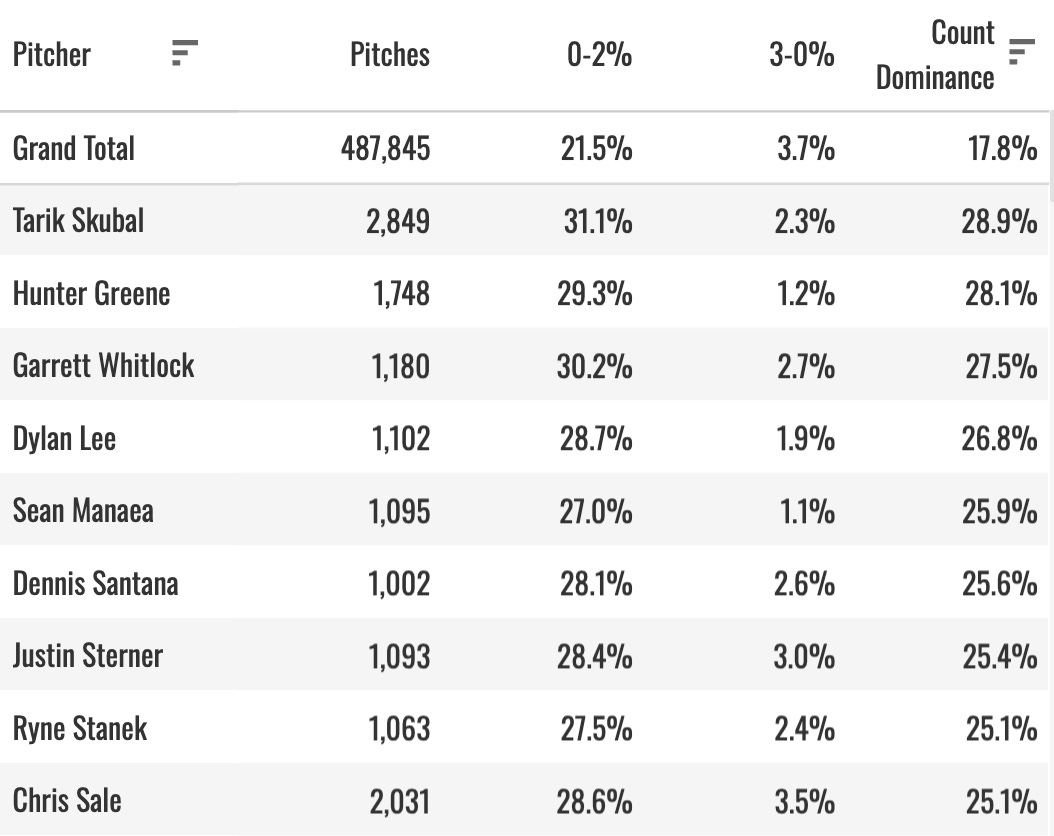
Tarik Skubal and Hunter Greene being on top is a positive sign. If you’re trying to measure pitcher dominance, you want to see Skubal on the top. He took an astounding 31% of counts to 0-2 and only went to 3-0 2.3% of the time.
On the bad end of the spectrum:
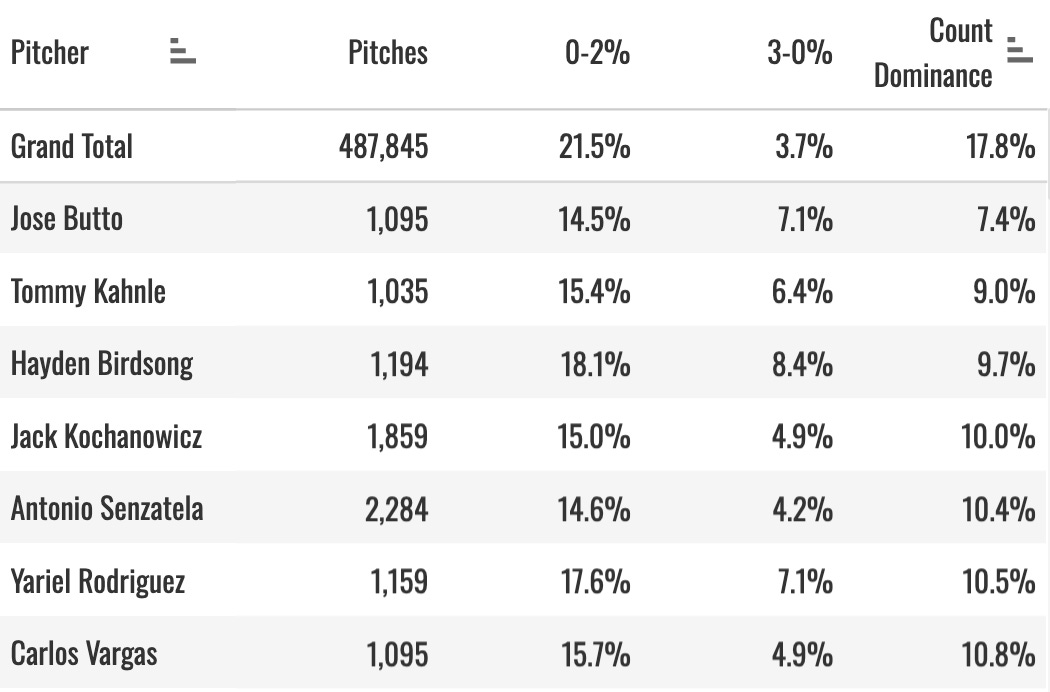
It all makes sense. Great pitchers on top, horrible pitchers at the bottom.
But I haven’t told you anything you didn’t already know at this point! To do that, we compare COUNT DOMINANCE with K-BB%.
Here’s the plot from the 2025 season requiring at least 15 starts:
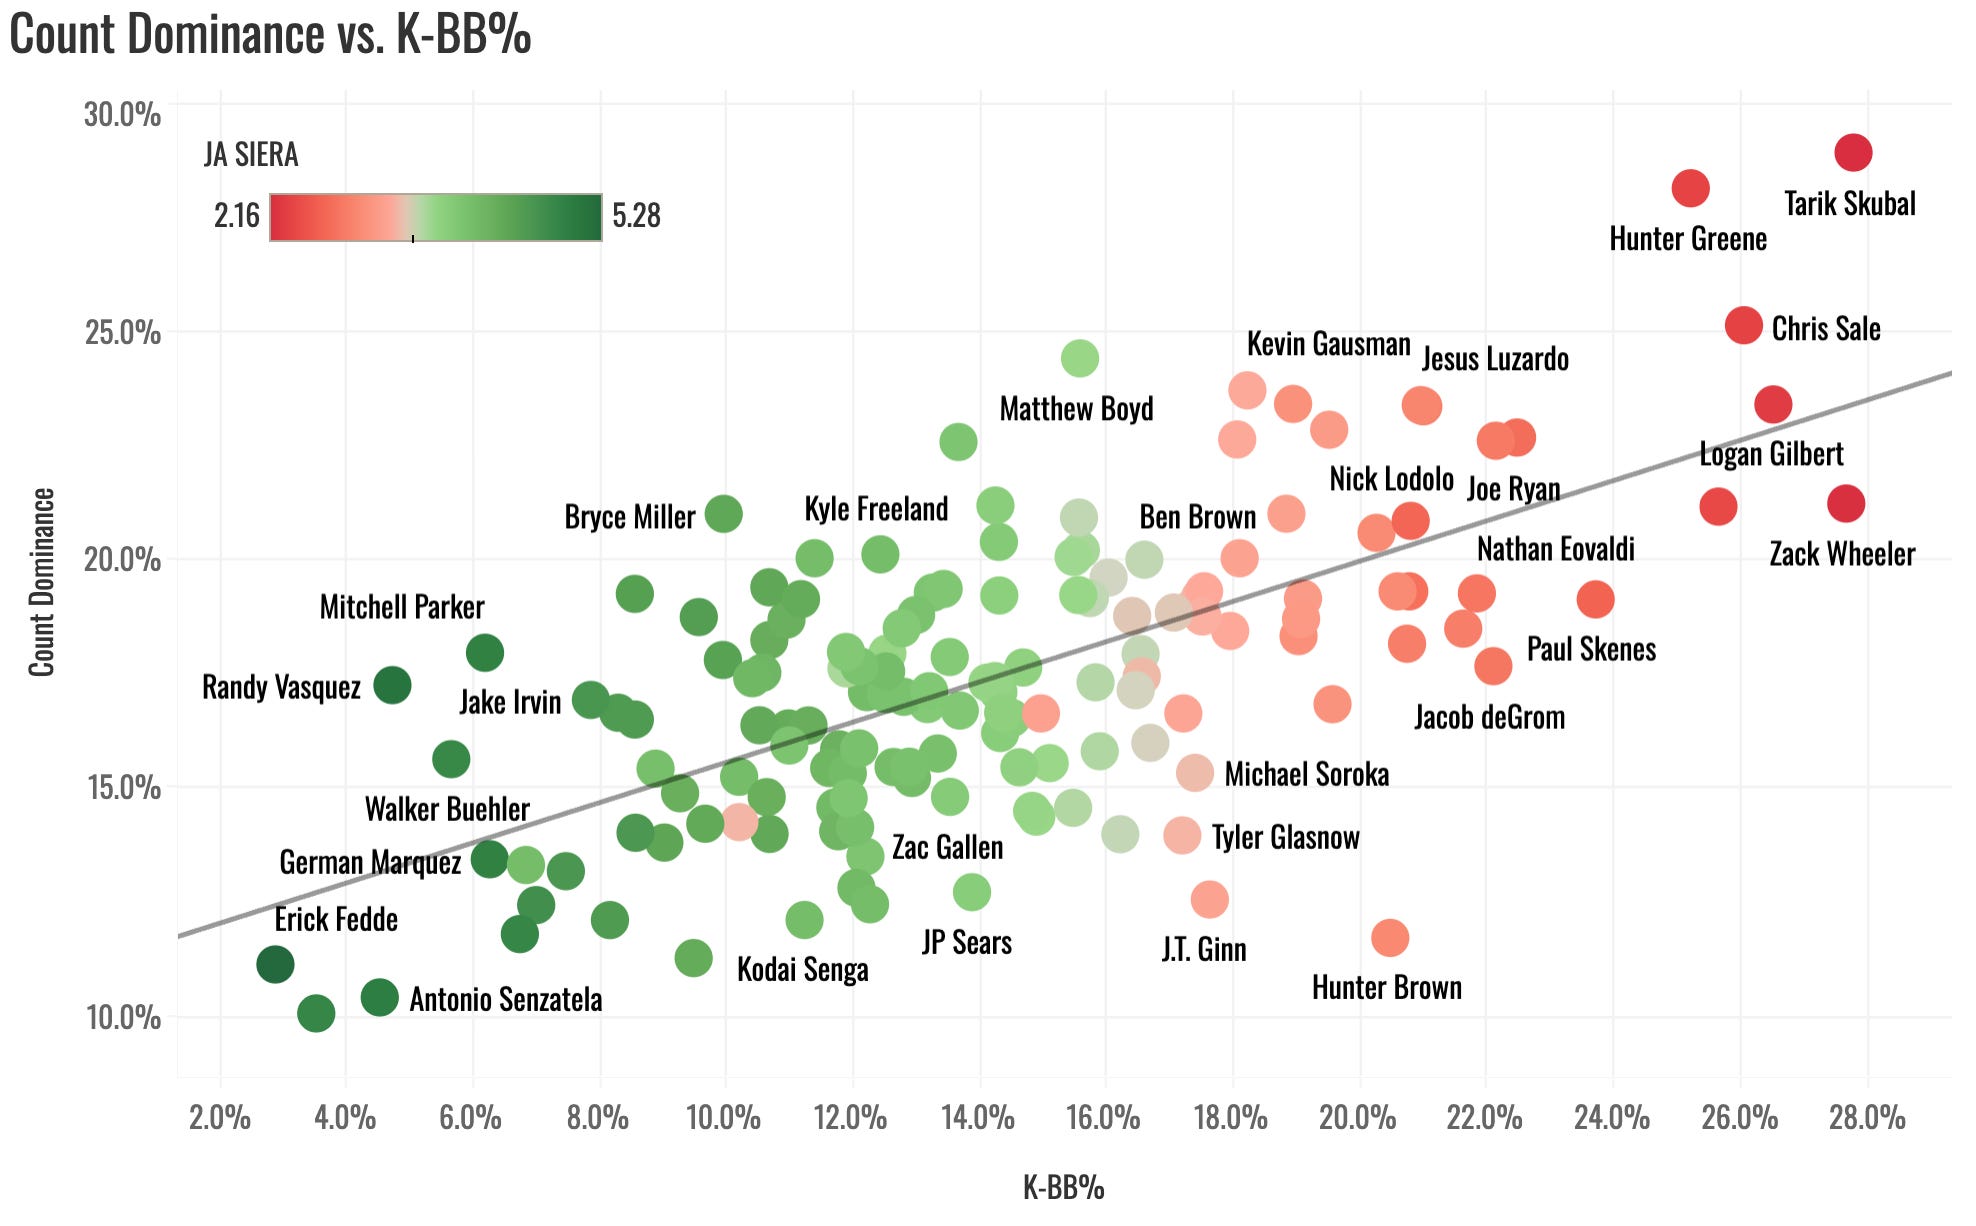
You can see a pretty decent relationship between the two. And that’s logic. 0-2 count rate is correlated with strikeouts, and 3-0 count rate is correlated with walks. We’re just like removing one step, basically.
As with any scatter plot, we’re most interested in THE OUTLIERS.
And one massive outlier appears. It’s that man Hunter Brown:
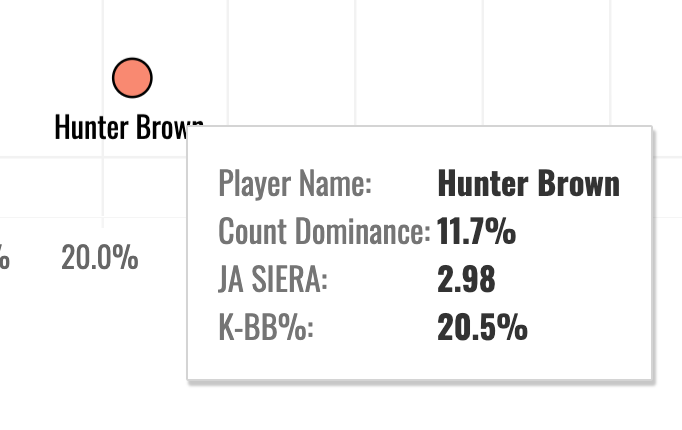
When looking at all SPs with at least 15 starts, Brown ranked #15 in K-BB%. But he ranked #144 in count dominance. I pulled those ranks for every SP (15 GS) and found rank gaps. Brown and JT Ginn towered above the rest of the league.
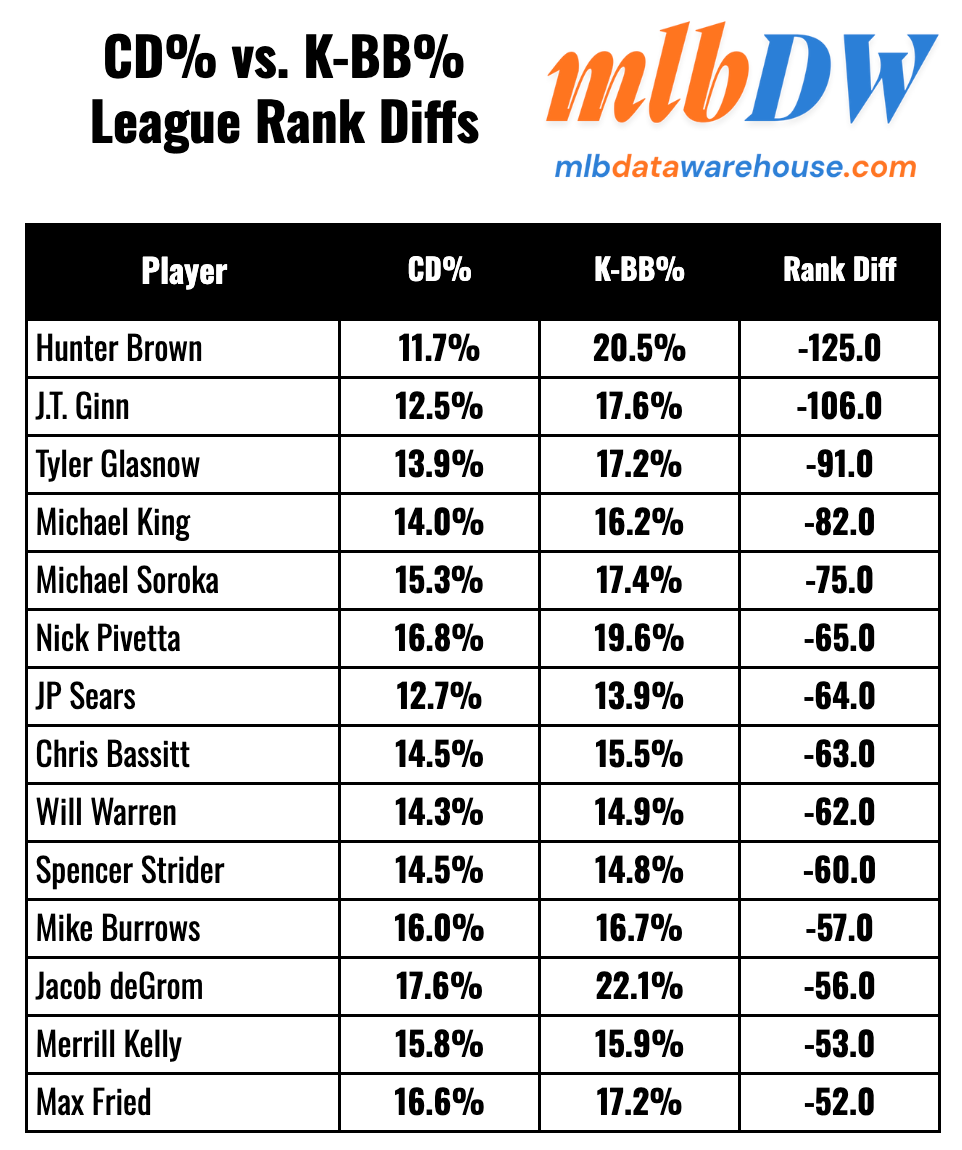
Simply put, Hunter Brown worked his way out of a lot of unfavorable counts. Some of that is to his credit. The dude threw strikes when he had to throw strikes.
This is a brand new stat that I haven’t fully studied, and I don’t feel like doing the nitty-gritty statistical analysis today. So I can’t speak exactly to repeatability or stickiness or whatever in this arena. But I’m confident in saying that there’s a large amount of randomness involved.
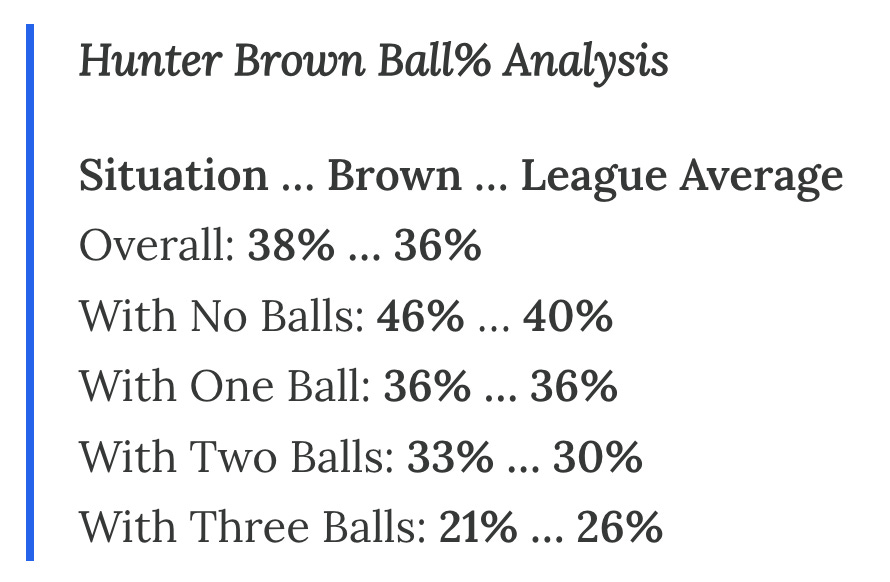
I would highly doubt that Brown is able to pull off another 21% Ball% in three-ball counts. If we look at 2024, Brown threw a ball 26% of the time in three-ball counts (the exact league average).
It was the same with Strike% and K% as well for Brown. His 46.3% Strike% was below the league average, but he somehow put up a 28.2% K%. He had trouble getting strikes basically in every count except for two-strike counts.
Maybe he’s just magic, I don’t know. It’s possible that he just kinda friggs off until he’s up against a make-or-break pitch. Who knows. The world’s a weird place. But more likely, I think, is that the guy ran very hot and won’t repeat another 20% K-BB% next year.
The point of this post is not to focus in on trashing Hunter Brown. I’m happy to do that as long as Hunter Brown isn’t like in the same room as me, but that’s not the point. It’s to tell you what this stat is, where to find it, and how to use it.
All the names in the graphic above are in similar positions. It seems likely that they overperformed in K-BB% last year and shouldn’t expect a repeat next year.
But let’s flip things around and talk about the inverse:
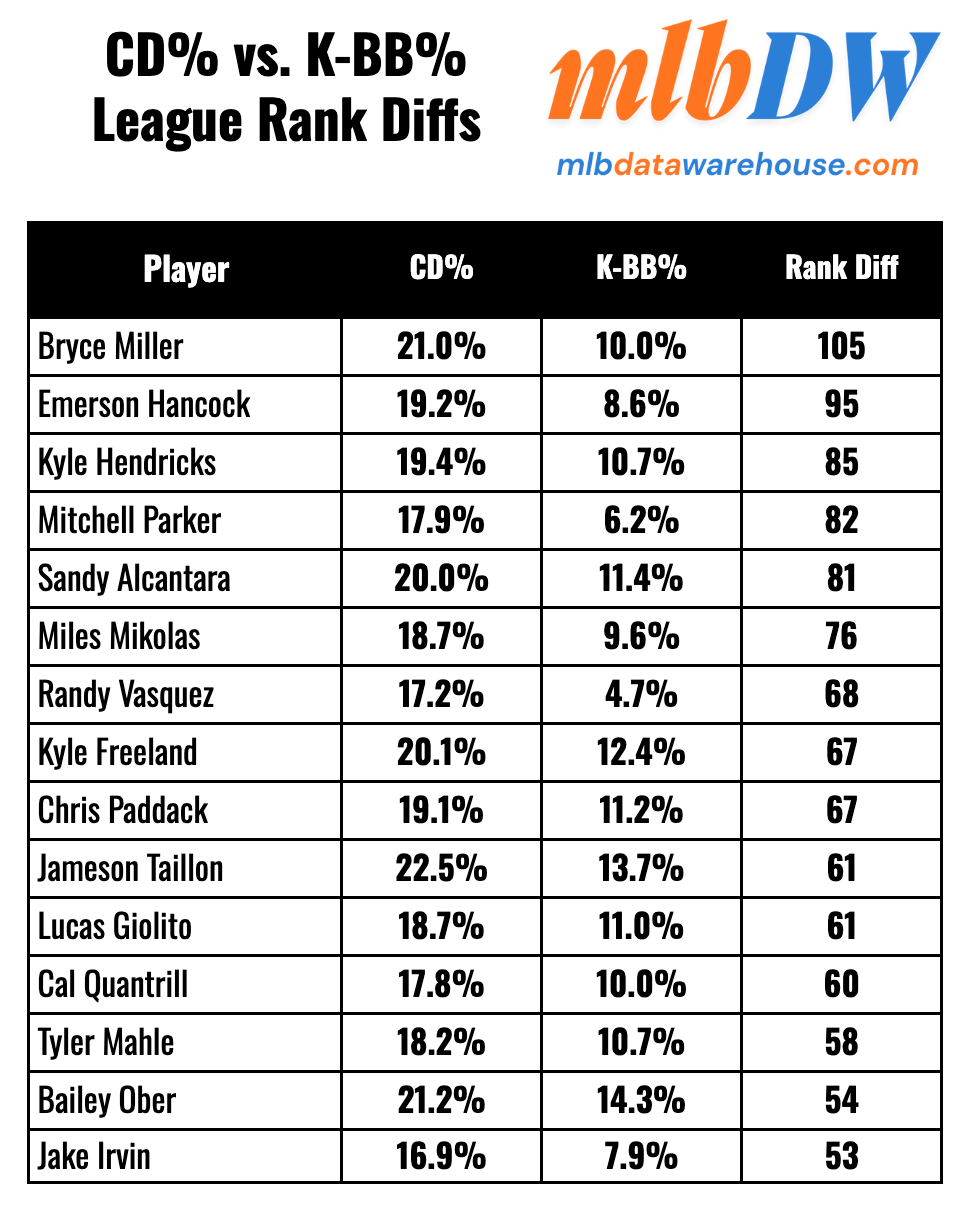
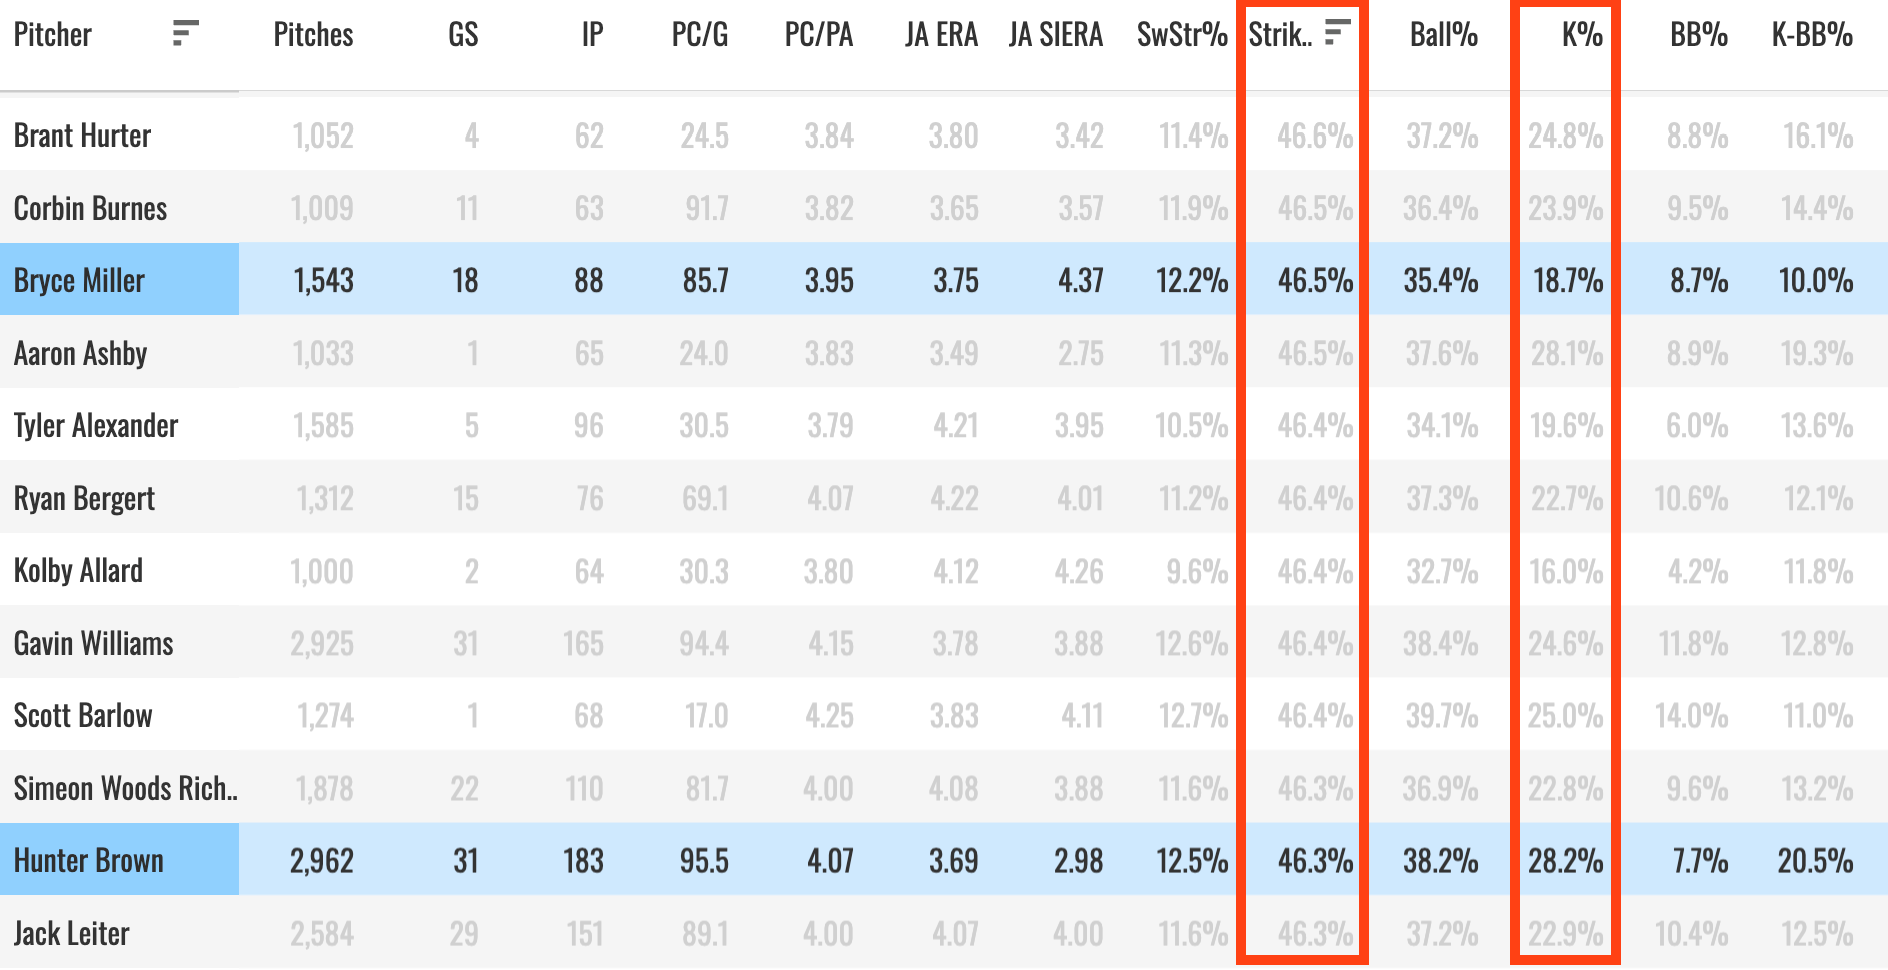
Not many interesting SPs for fantasy purposes on this list. Hancock, Hendricks, Parker, Mikolas, Vasquez, Freeland, Paddack, Quantrill, Mahle, and Irvin are off the list for 2026 already. But we can look at a guy like Bryce Miller:
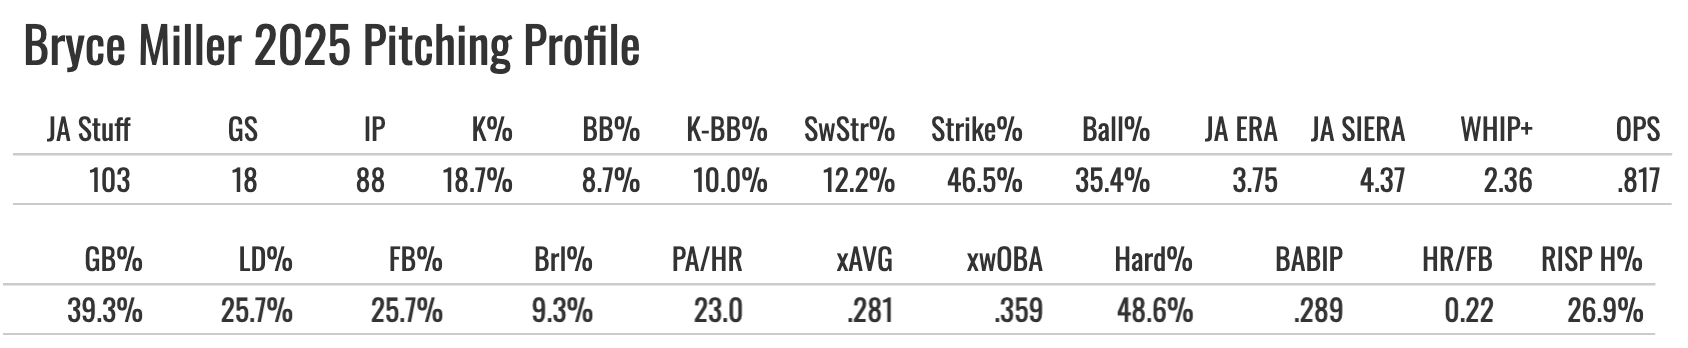
Same 46.5% Strike% as Hunter Brown! And yet almost ten points lower in K%. His Ball% was a point better than Brown, but his walk rate was a point worse!
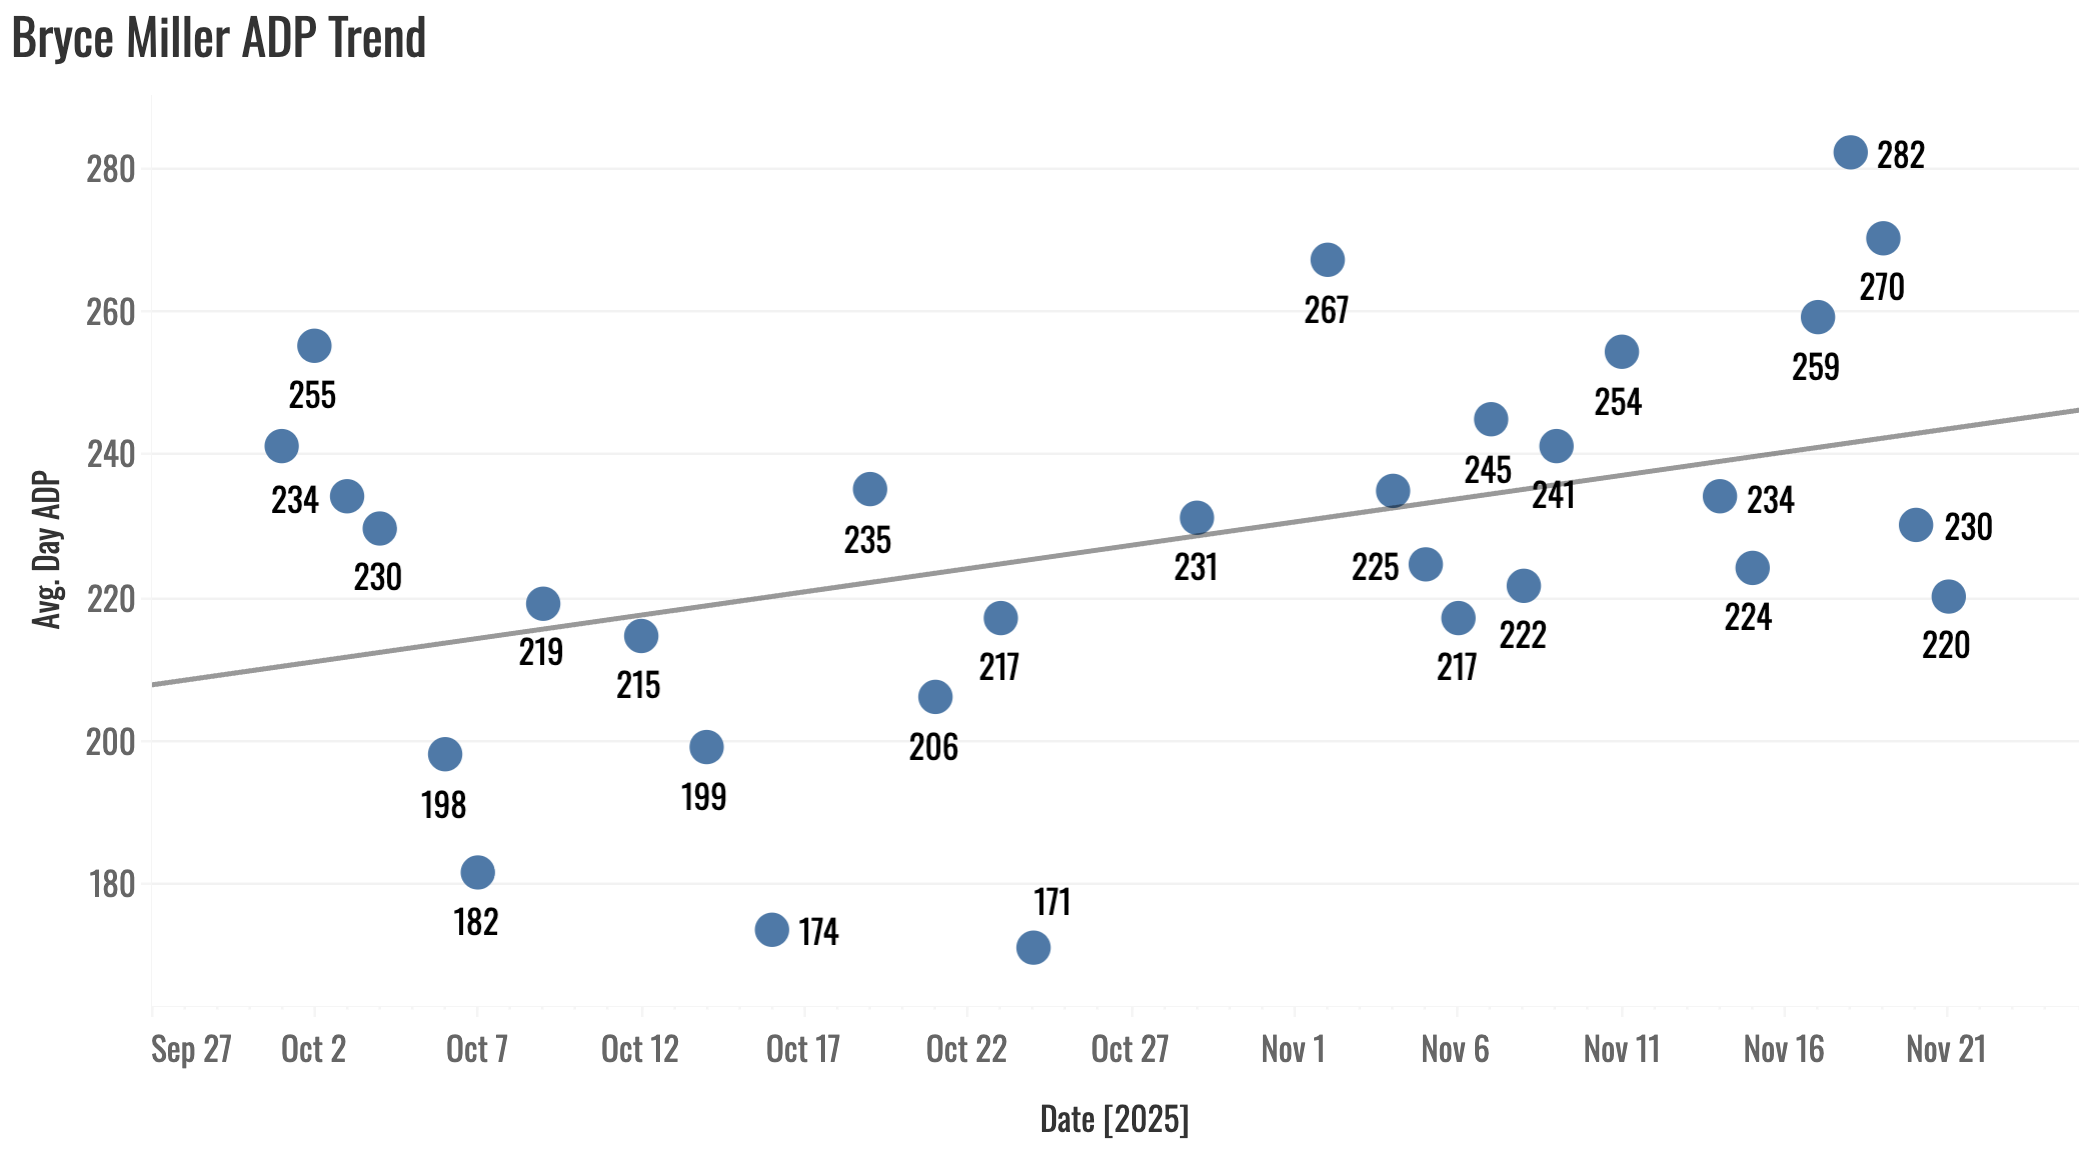
Miller is very, very affordable in drafts this year. Some of that has to do with his bad performance in 2025, but most of it is about the health questions. We saw a “probably won’t need surgery” report on him after the Mariners were eliminated from the postseason. That’s what you call bad news disguised as good news.
That’s all I wanted to say. This is one for the “Knowledge Base”. That’s where I’m keeping all of these articles that explain some of the custom stats and processes I have here at MLB DW. You’ll find count dominance on the main pitcher tab of the dashboard.
I hope it freaking changes your life for the better, and I hope you never forget the day you read this here article. May God bless you.