


I had a new idea, and I already put it into play on the main MLB dashboard. It’s EXPECTED RBIs.
How It Works
I’ll explain it quickly; it’s a pretty simple idea. Each situation when a batter comes to the plate has different RBI opportunities depending on two things:
Who is on base
How many outs there are
Most of it is about that first point, but the outs matter a bit too. If you’re up with nobody on base, your expected RBI for that plate appearance is 0.03, because 3% of MLB plate appearances end in a home run.
The best spot for an RBI is bases loaded with one out. You expect something like 0.8 RBIs from those PAs on average. Why is one out better than two outs? It probably has to do with the infield being at double-play depth when there is one out. With nobody out, they’ll often play in and try to get the runner out at home.
But we don’t have to get into all of the different situations. What we can do, and what I’ve done, is apply each situation from this year and assign the xRBI for each PA, and then sum them up for the season.
This does not factor who the hitter is at all. That’s an important thing to understand for this. If Yordan Alvarez and Chandler Simpson both come to the plate 200 times with a man on first and two outs, Alvarez is going to have a bunch more RBIs than Simpson because he will have a ton more extra base hits to score that runner from first (and himself). So this is an expected RBI total only based on the situations they’ve been in when at the plate, it has nothing to do with their individual abilities.
Does This Matter
I would say largely NO. It’s a good descriptive stat, but it doesn’t do much for us in predictive power. There’s a little bit of that. And we’ll see those examples play out.
The key example right now is Sal Stewart. He’s #1 in the league in RBI with 105, but has a .487 SLG and .825 OPS that are a long way away from the league leaders.
What we’ll see is that he’s just come up to the plate with a ton of runners on base, way more than other guys with a similar number of games played.
That would help us temper our RBI expectations for him next year. But if you’re drafting with projections, that will already be taken care of. If you’re looking at projections, you have to be careful not to double-count things like this. The projections are done in a way that regresses all of the things that hitters don’t control to/toward the average.
Why Do It Then
Because we live in a world where we don’t have to go hunt for our dinners. We have a lot of free time, we like baseball, and this is fun.
So let’s do it then! Here’s your new tab if you’re a paid sub with the dashboard access:
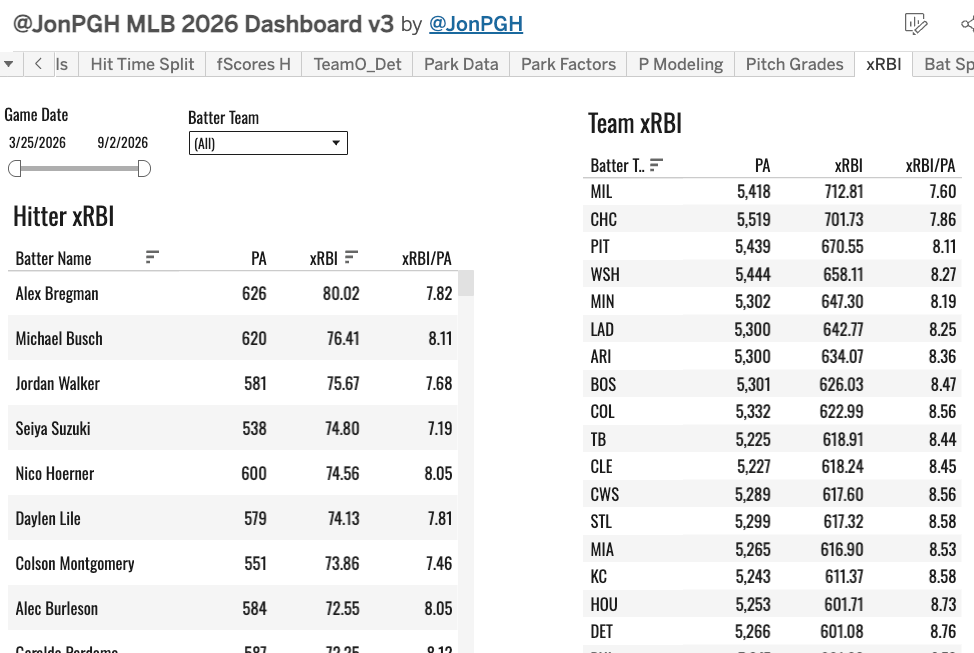
And there you see the top guy. It’s Alex Bregman, with 80 xRBI this year. Michael Busch is #2. Seiya Suzuki is #4. Nico Hoerner is #5.
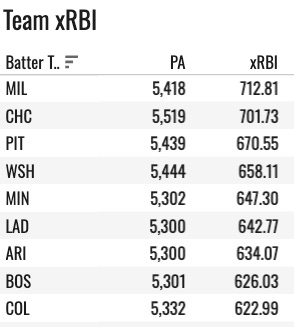
So you know something right away - it’s largely team based. It’s playing time based primarily, and the Cubs have been the healthiest offense in the league by far. Those guys have all basically played every day, and it’s a super high OBP lineup. They’ve had a ton of opportunity.
The top ten teams:
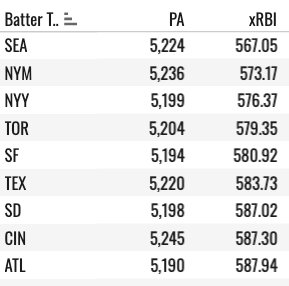
The bottom ten teams:
You can also set a minimum PA and sort by xRBI per PA:
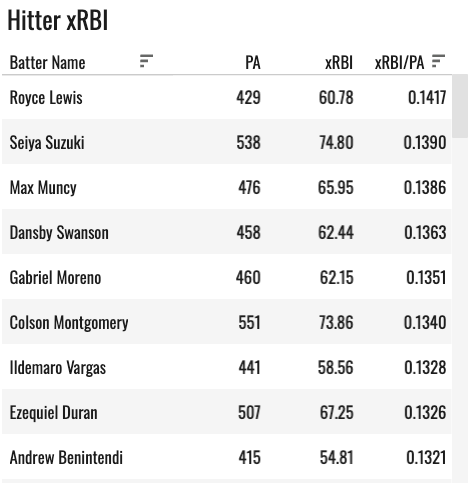
That’s going to be all dudes hitting in the middle of the lineup a lot, with a lot of randomness/luck involved.
The bottom of the list is pretty wild:
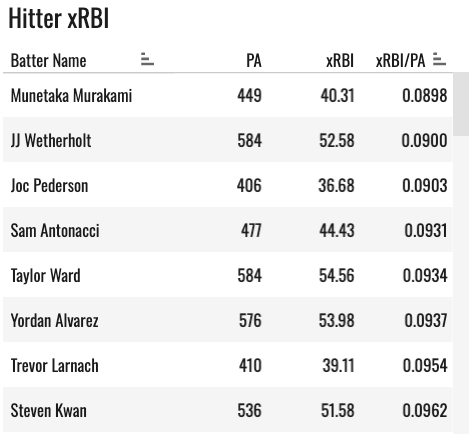
Murakami with the lowest RBI opportunity in the league! He has just 59 RBIs despite 29 bombs, so that is a surprisingly low number that should speed up in the future.
But the lead-off hitter is severely disadvantaged in this category because they’re coming to the plate at least once per game with nobody on base.
So you can poke around there on the dashboard. This is more interesting when we compare it to actual RBI. I can’t do actual RBI on that dashboard accurately because it’s the Savant pitch-by-pitch dataset powering it. And I can’t get exact RBI results from that data.
But I have a Google Sheet for the comparison now.
“Over Performers”
I put it in quotes because dudes with a bunch of homers will overperform there just because they’re hitting homers at a higher rate than this calculation would give them credit for. It assumes all hitters are average, and not all hitters are average.
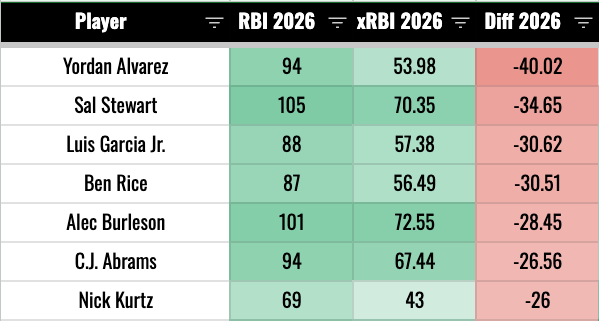
Yordan Alvarez has not had many guys on base ahead of him this year, but he’s driven in 94 anyways. That’s what a 1.037 OPS can do for you.
Sal Stewart’s 105 RBIs are 35 above his average. He does not have a gaudy OPS like Alvarez. He does have 31 bombs, but he’s been lucky to come up with so many runners on base, and he’s been lucky to drive in as many as he has in those situations.
Sal Stewart Splits
Bases Empty: .254 AVG, 122 wRC+
Men On Base: .279 AVG, 119 wRC+
Men In Scoring Position: .317 AVG, 154 wRC+
The analytics haters will say he’s just a clutch hitter and will continue to hit better with men on base. But that is nonsense; it’s not a thing hitters can do year in and year out. If they could just hit better sometimes, they’d do it all the time.
So this is another common thread through the names at the top and bottom of these differential lists, it largely has to do with how far above or below your average you’re hitting with men in scoring position. It’s another thing the projections will take care for us when projecting next year.
The other big “over-performers” were shown above and you can see the full list by checking out that Google sheet. I’m more or less trying to tell you what this data is, what to know about it, and how to use it - if there’s any use for it at all.
“Under-Performers”
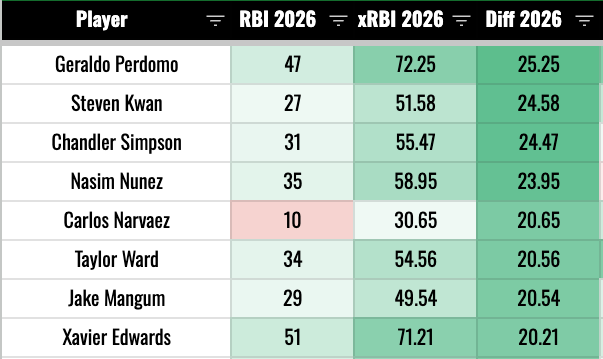
What you’ll have here are guys who don’t hit homers. Big RBI totals come from homers. Chandler Simpson and Steven Kwan will “under perform” this every year because they basically need a guy to be on second base to drive anybody in.
But it’s a good way to know if a guy on your team who has had a big RBI season can repeat it next year.
RISP ANALYSIS
Let’s look at the biggest wRC+ gaps between situations where there’s nobody on base and situations where there’s someone in scoring position.
Here are the guys who have hit a lot better with men in scoring position:
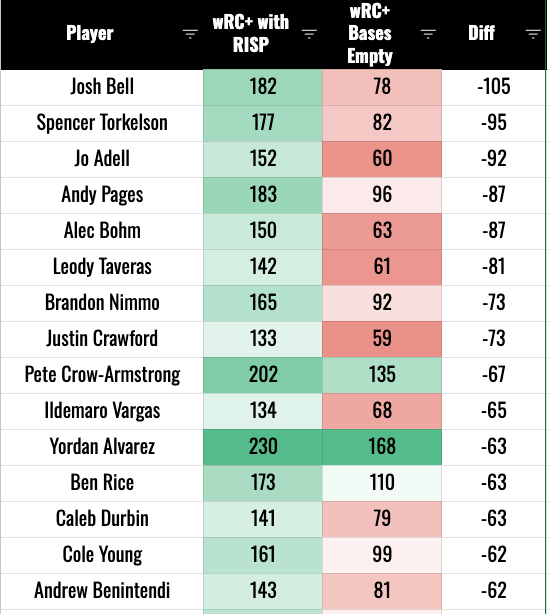
Josh Bell has 84 RIs with a .740 OPS and 17 homers. For comparison, Kyle Schwarber has 83 RBIs with an .872 OPS and 40 homers. He leads off, Bell doesn’t, but STILL.
So those would be guys who will see their RBI pace slow down in the near future.
Now, the other way around, guys who should get more RBIs as time progresses as the timing of their hits balance out:
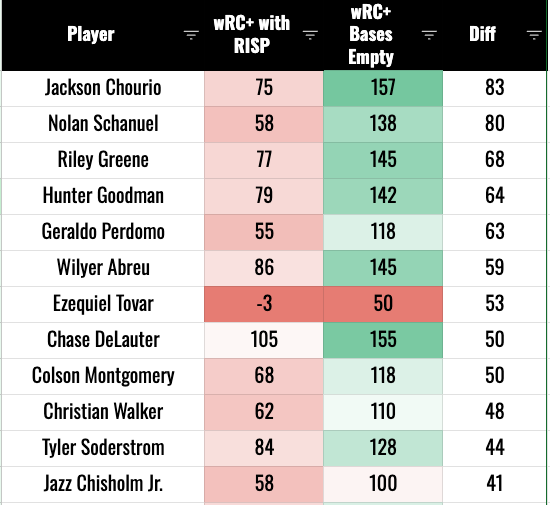
That’s a -3 wRC+ for Ezequiel Tovar with RISP. Laughable.
Jackson Chourio is the big name here. 157 wRC+ with the bases empty, 75 with runners in scoring position. He’s got a decent RBI total (58 in 101 games), but it could be a lot higher than that.
Lots more stuff to look into if you want to jump into the splits on those standout names, but that’s all I have for you today! Here’s hoping this helped you enjoy ten minutes of your time today.