
How to Use the MLB DW Sim Tool
Trevor dives into the new MLB DW game sim tool and gives you some tips on how to use it

This tool and many other projection-based tools and reports are available to MLB DW Pro members only. The price is $125 for the rest of the season; simply a price you won’t find elsewhere. Other sites charge a couple of hundred dollars monthly.
How to Use the Sims
What It Is, Why It Matters
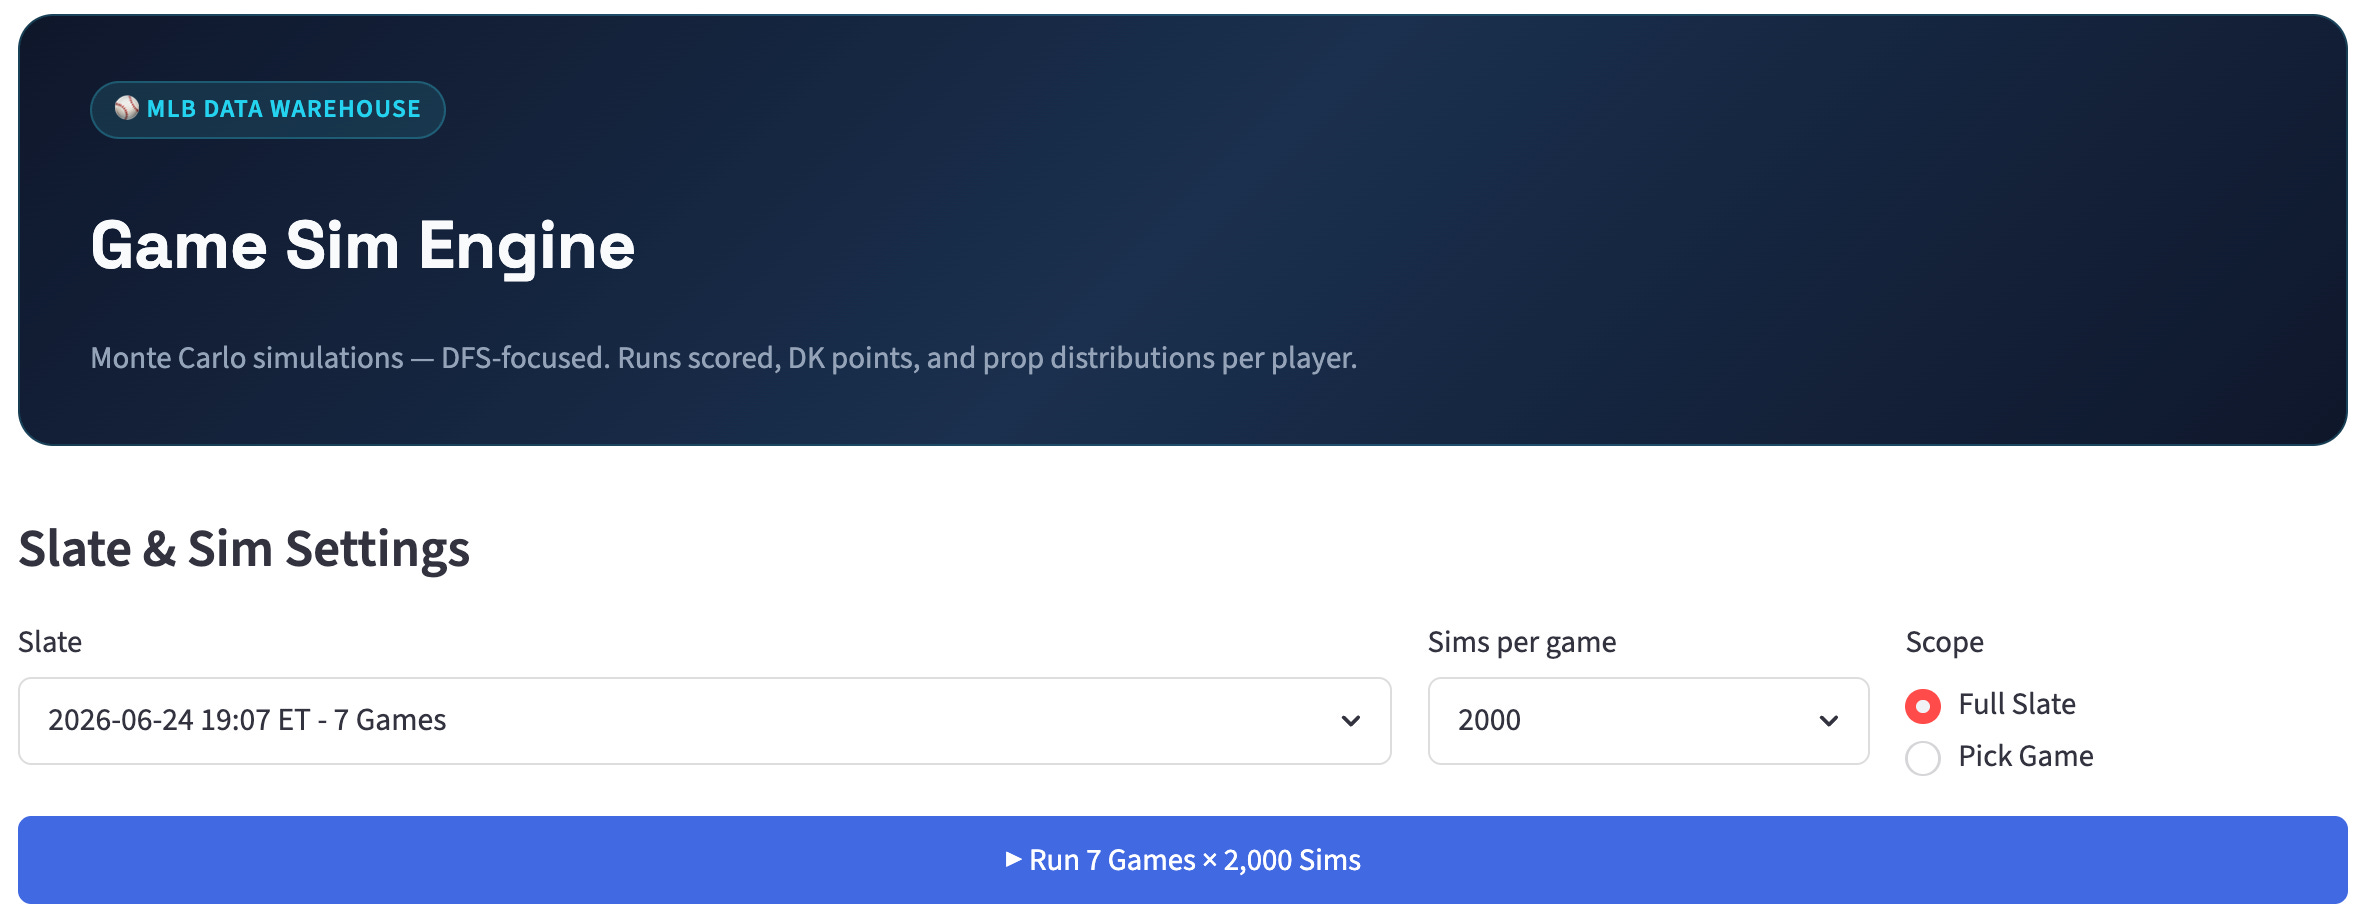
The sim plays the full slate hundreds of times and gives you three things a flat projection never can: a simulated DraftKings score for every player, a self-generated run environment for every game, and win and over probabilities straight from the simulation. You are not borrowing Vegas totals anymore. The sim builds its own.
Three tabs do the work. Slate Summary for the run environment. DFS Leaders for player selection. Game Detail for stacking and pitcher reads on individual games.
The Run Sizes: 250, 500, 1000, 2000
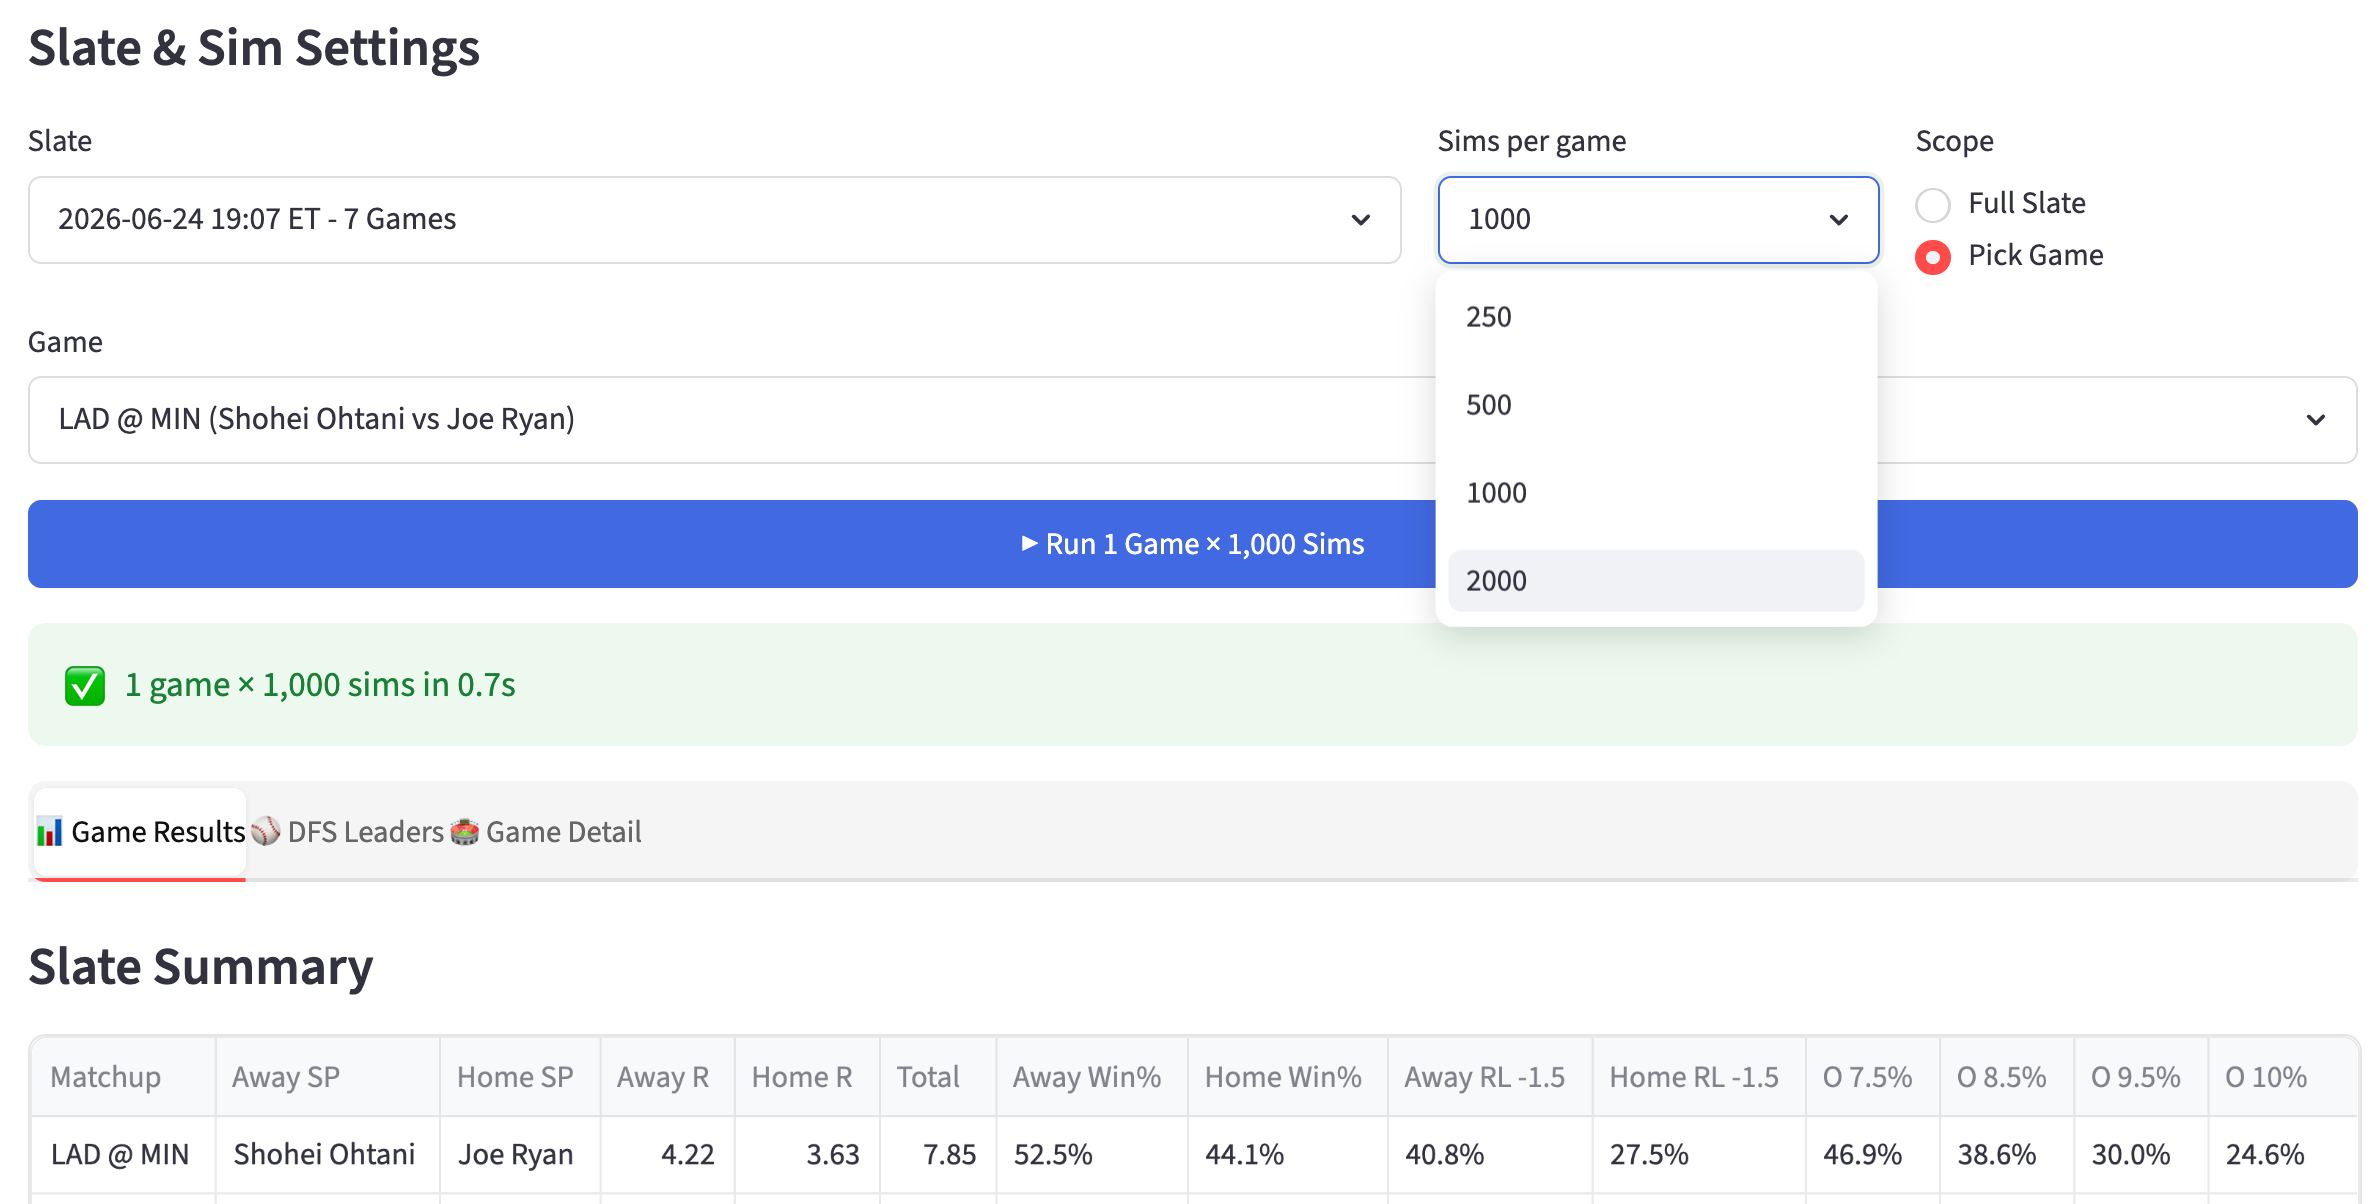
These set how many times the sim plays the slate. More runs make the rare outcomes reliable, which is where tournaments are won.
250. Fast early look. Tails are noisy. Rough shape only.
500. Stable for the core. Good for cash reads and the run environment.
1000. The tournament standard. Ceiling (90%) and Diff become trustworthy. Use once lineups are mostly confirmed.
2000. Final build confidence. The extra runs sharpen the ceiling and the win percentages, which is exactly what you trust for final MME exposures.
Low count to explore early, high count to confirm late.
Slate Summary: This is Your Run Environment
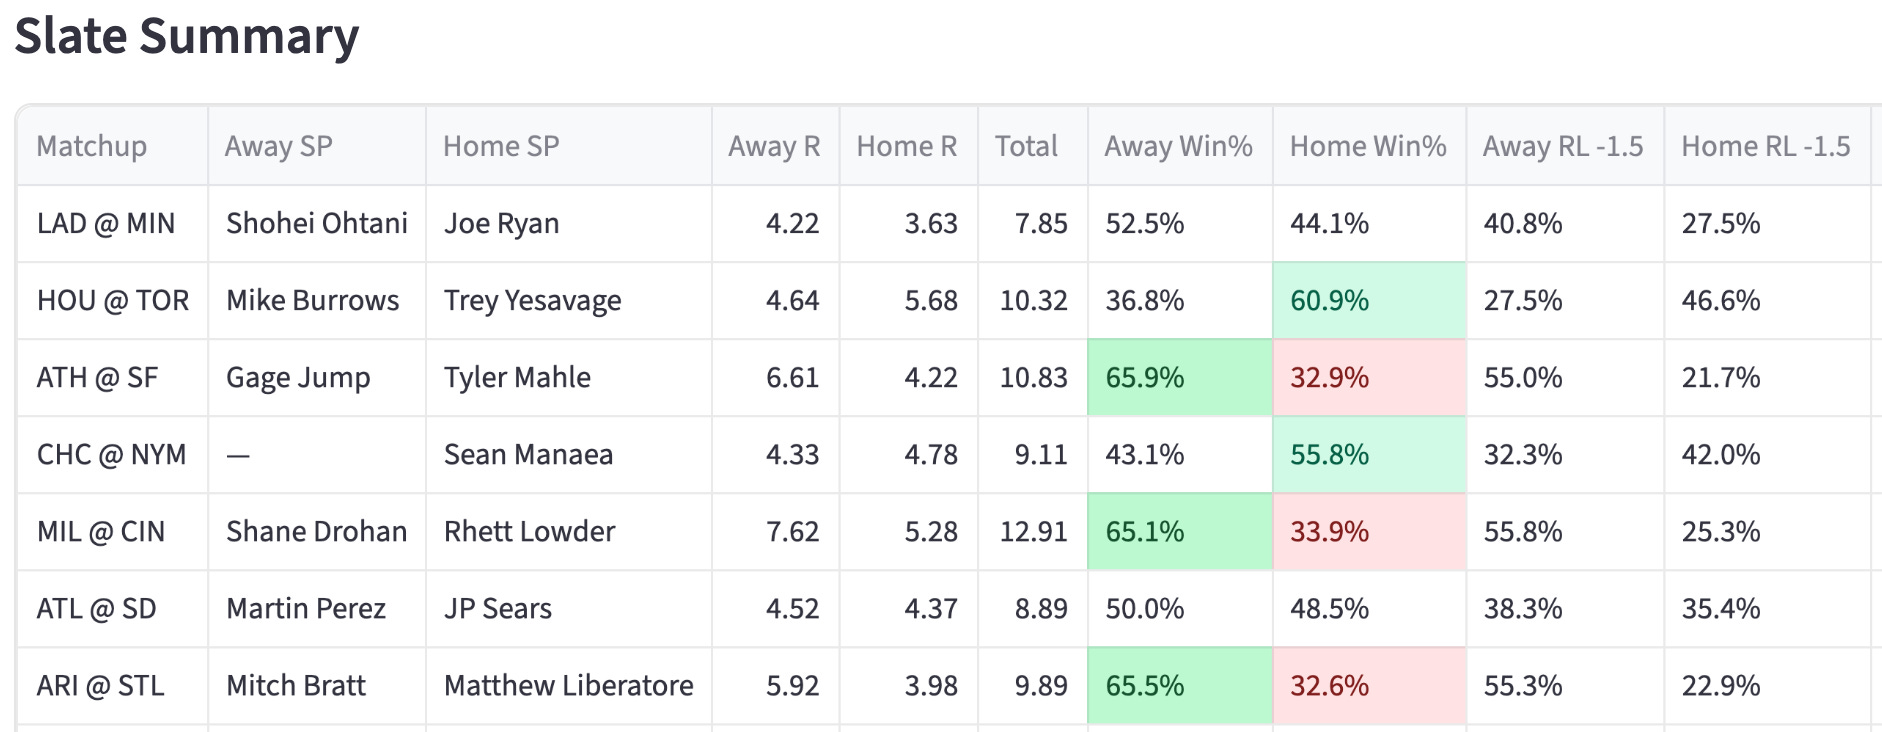
The Total column is the sim’s projected game total. Rank the slate by it. In these screenshots, MIL at CIN sims to 12.9 and ATH at SF to 10.8, while LAD at MIN sits at 7.8. That ranking is your stack priority board before you look at a single price.
The Away R and Home R columns are the sim’s implied team totals. This is the number that picks your stacks. Get your team totals here.
The Win% columns are your pitcher win-bonus read. A pitcher on a team winning 60%-plus of sims banks the four-point bonus far more often. The highest in that screenshot is the Athletics with a 66% chance to win - a win projection boost to Gage Jump.
Cross-reference win% with the matchup before trusting a pitcher’s ceiling.
The O 7.5 through O 10 columns are how often the game clears each total. MIL at CIN clears 9.5 in 68.8% of sims and even clears 10 in 61.8%. That is a smash-spot signal for stacking both sides and for bring-back logic. When a game clears double-digit totals most of the time, the bring-back is live. When a game rarely clears its number, skip the bring-back.
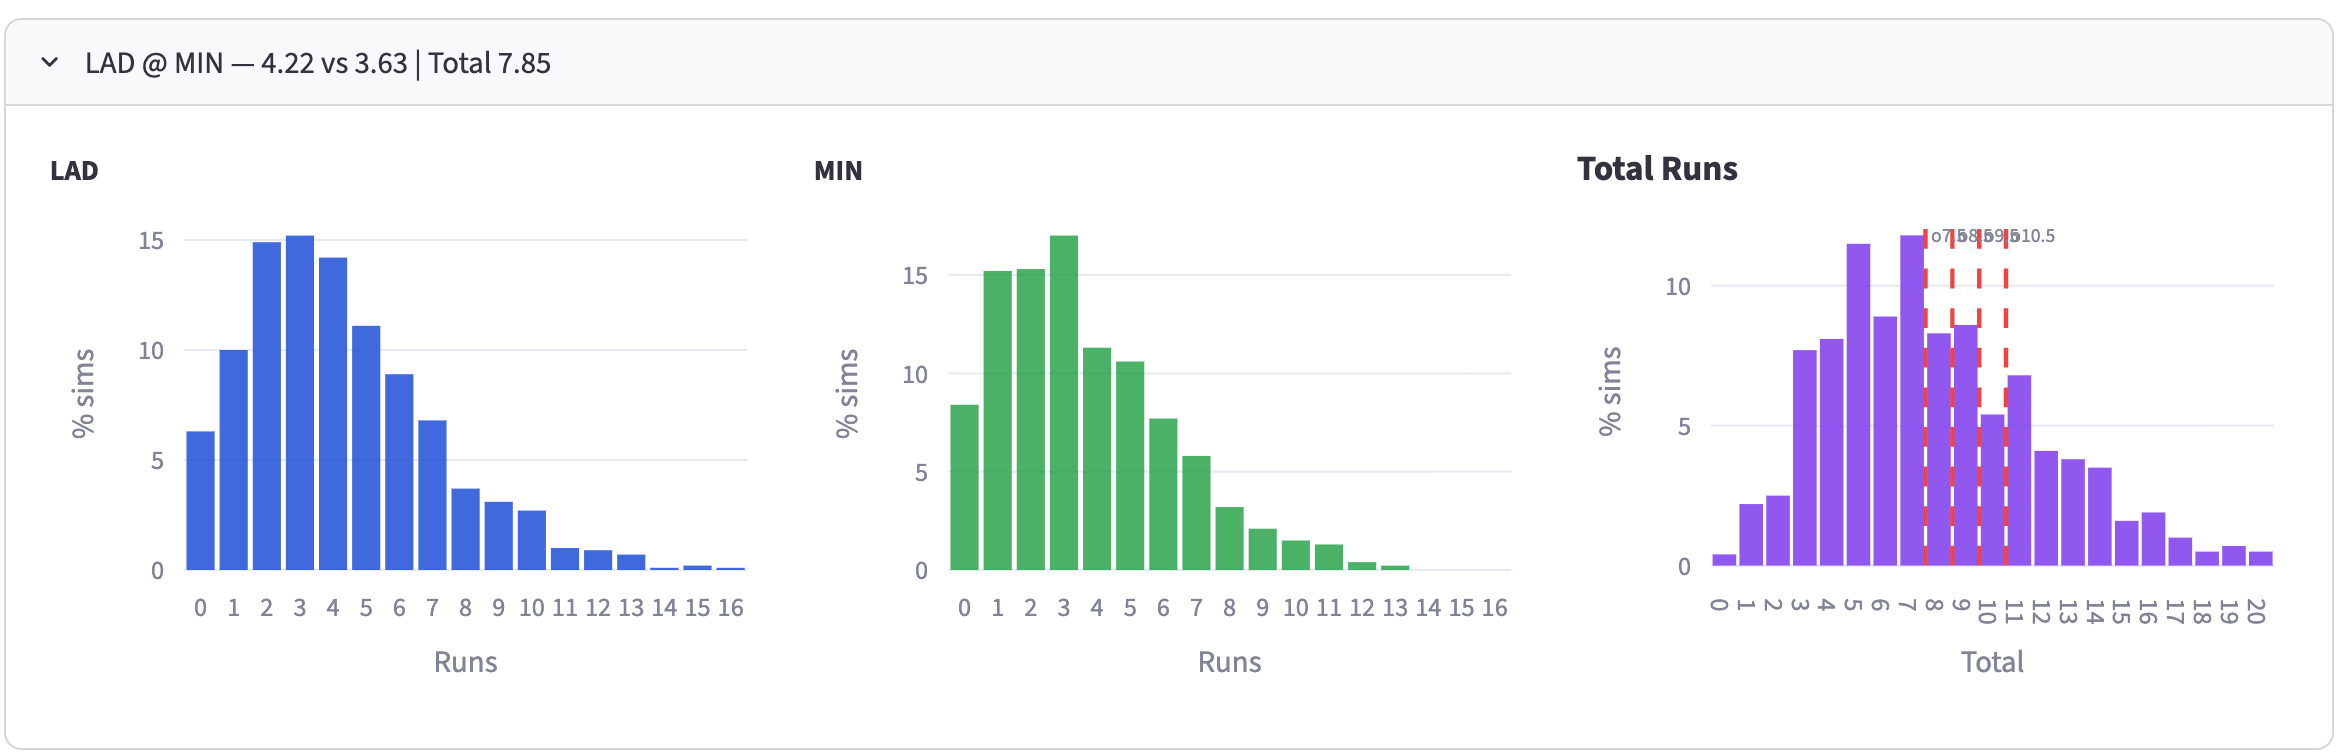
The Score Distributions expanders show the full shape of each game’s outcomes, not just the average. Open them on your target games to see how fat the right tail is. A game with a high average AND a fat right tail is a tournament game.
DFS Leaders: Your Player Pool
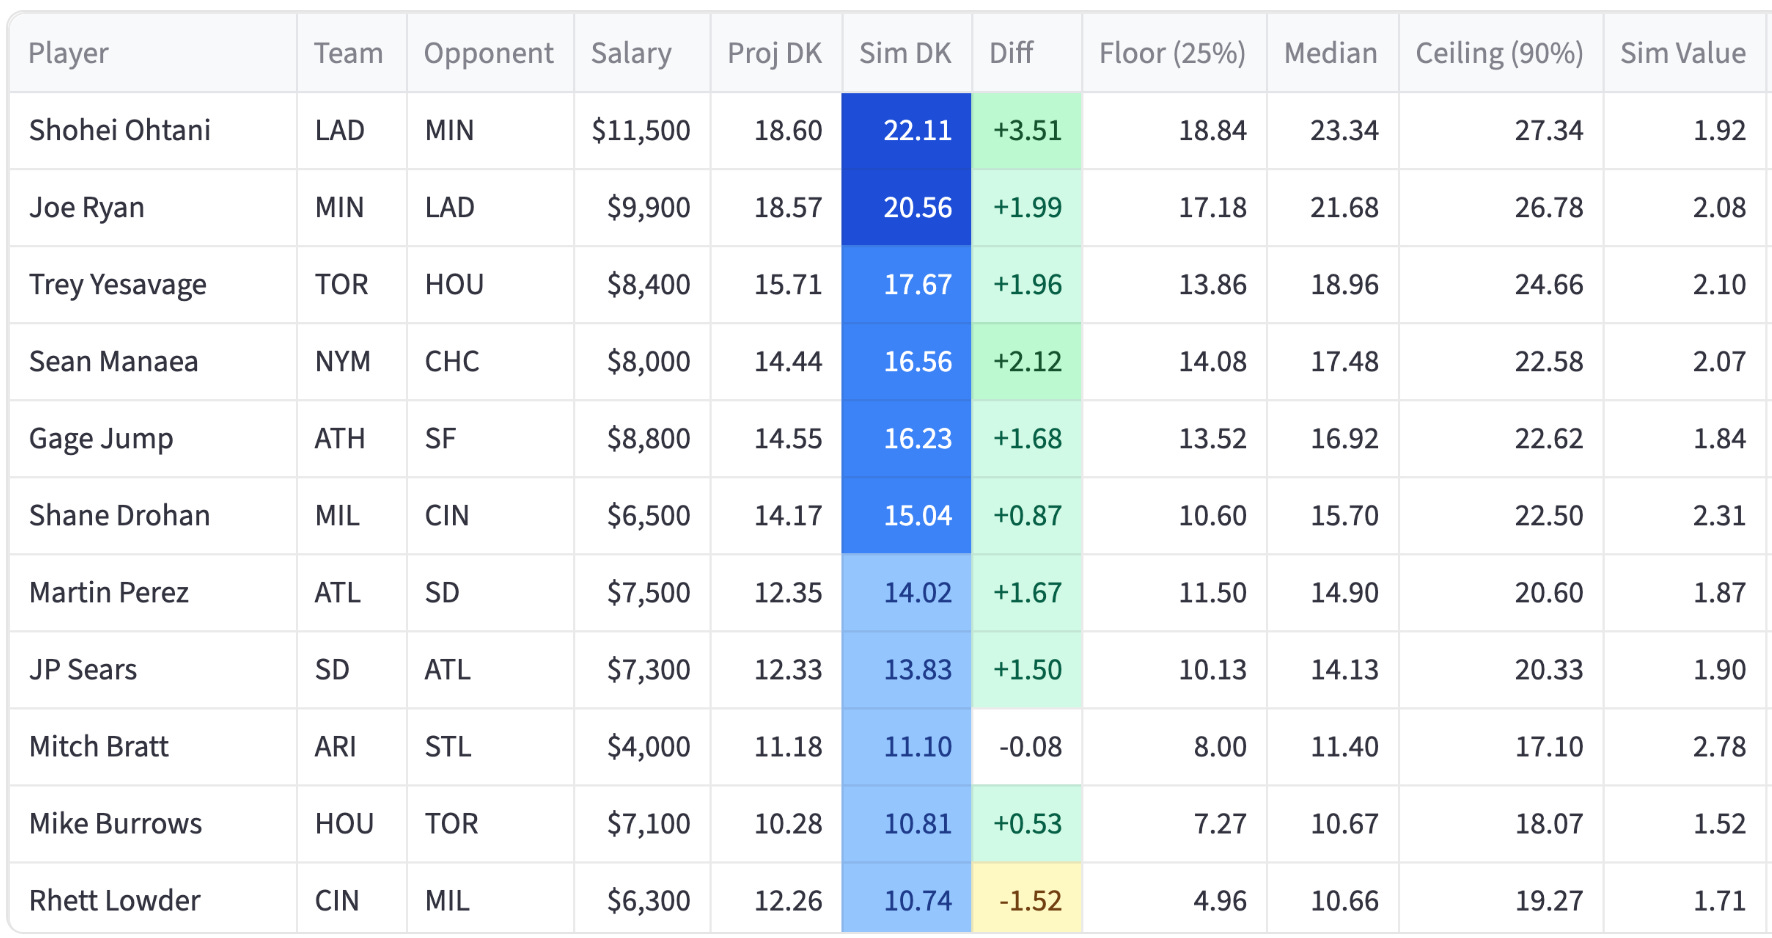
Sim DK is the simulated DraftKings score, the average across all runs. Compare it to Proj DK, the static projection. The Diff column does this for you. A positive Diff means the sim likes the player more than the base projection. Brice Turang projects 10.29, but sims 12.64, a +2.35 Diff. Those positive-Diff players are where the sim is telling you the field, anchored to the static projection, will be light.
Diff is your leverage engine. The field builds off Proj DK. You build off Sim DK. The gap between them, sorted by Diff, is a list of players the sim rates higher than the consensus number everyone else is using. That is exactly where tournament leverage lives. Sort by Diff and read the top of that list as your leverage pool.
Ceiling (90%) is the sort that matters for tournaments. It is the player’s 90th percentile sim outcome, the realistic ceiling. Sort by this for GPP hitter and pitcher selection. Cash uses Sim DK (the median-ish average). Tournaments use Ceiling (90%).
Sim Value is sim points per dollar. Sort by this to find the salary-relievers that let you afford the studs. This is your value-play finder for every position.
LU is the batting order spot from the sim’s lineup input. Use it to enforce stack correlation. A 2-3-4-5 stack shows as LU 2,3,4,5. This is how you confirm your five bats actually hit consecutively.
Avg H, HR, R, RBI, SB are the average box-score lines behind the sim score. Useful for understanding WHY a player sims well. A high Avg SB guy is a steals-correlation play. A high Avg HR guy carries the power ceiling.
Game Detail: Single Game Deep Dive
Use it on your two or three target games once you’ve picked them off the Slate Summary.
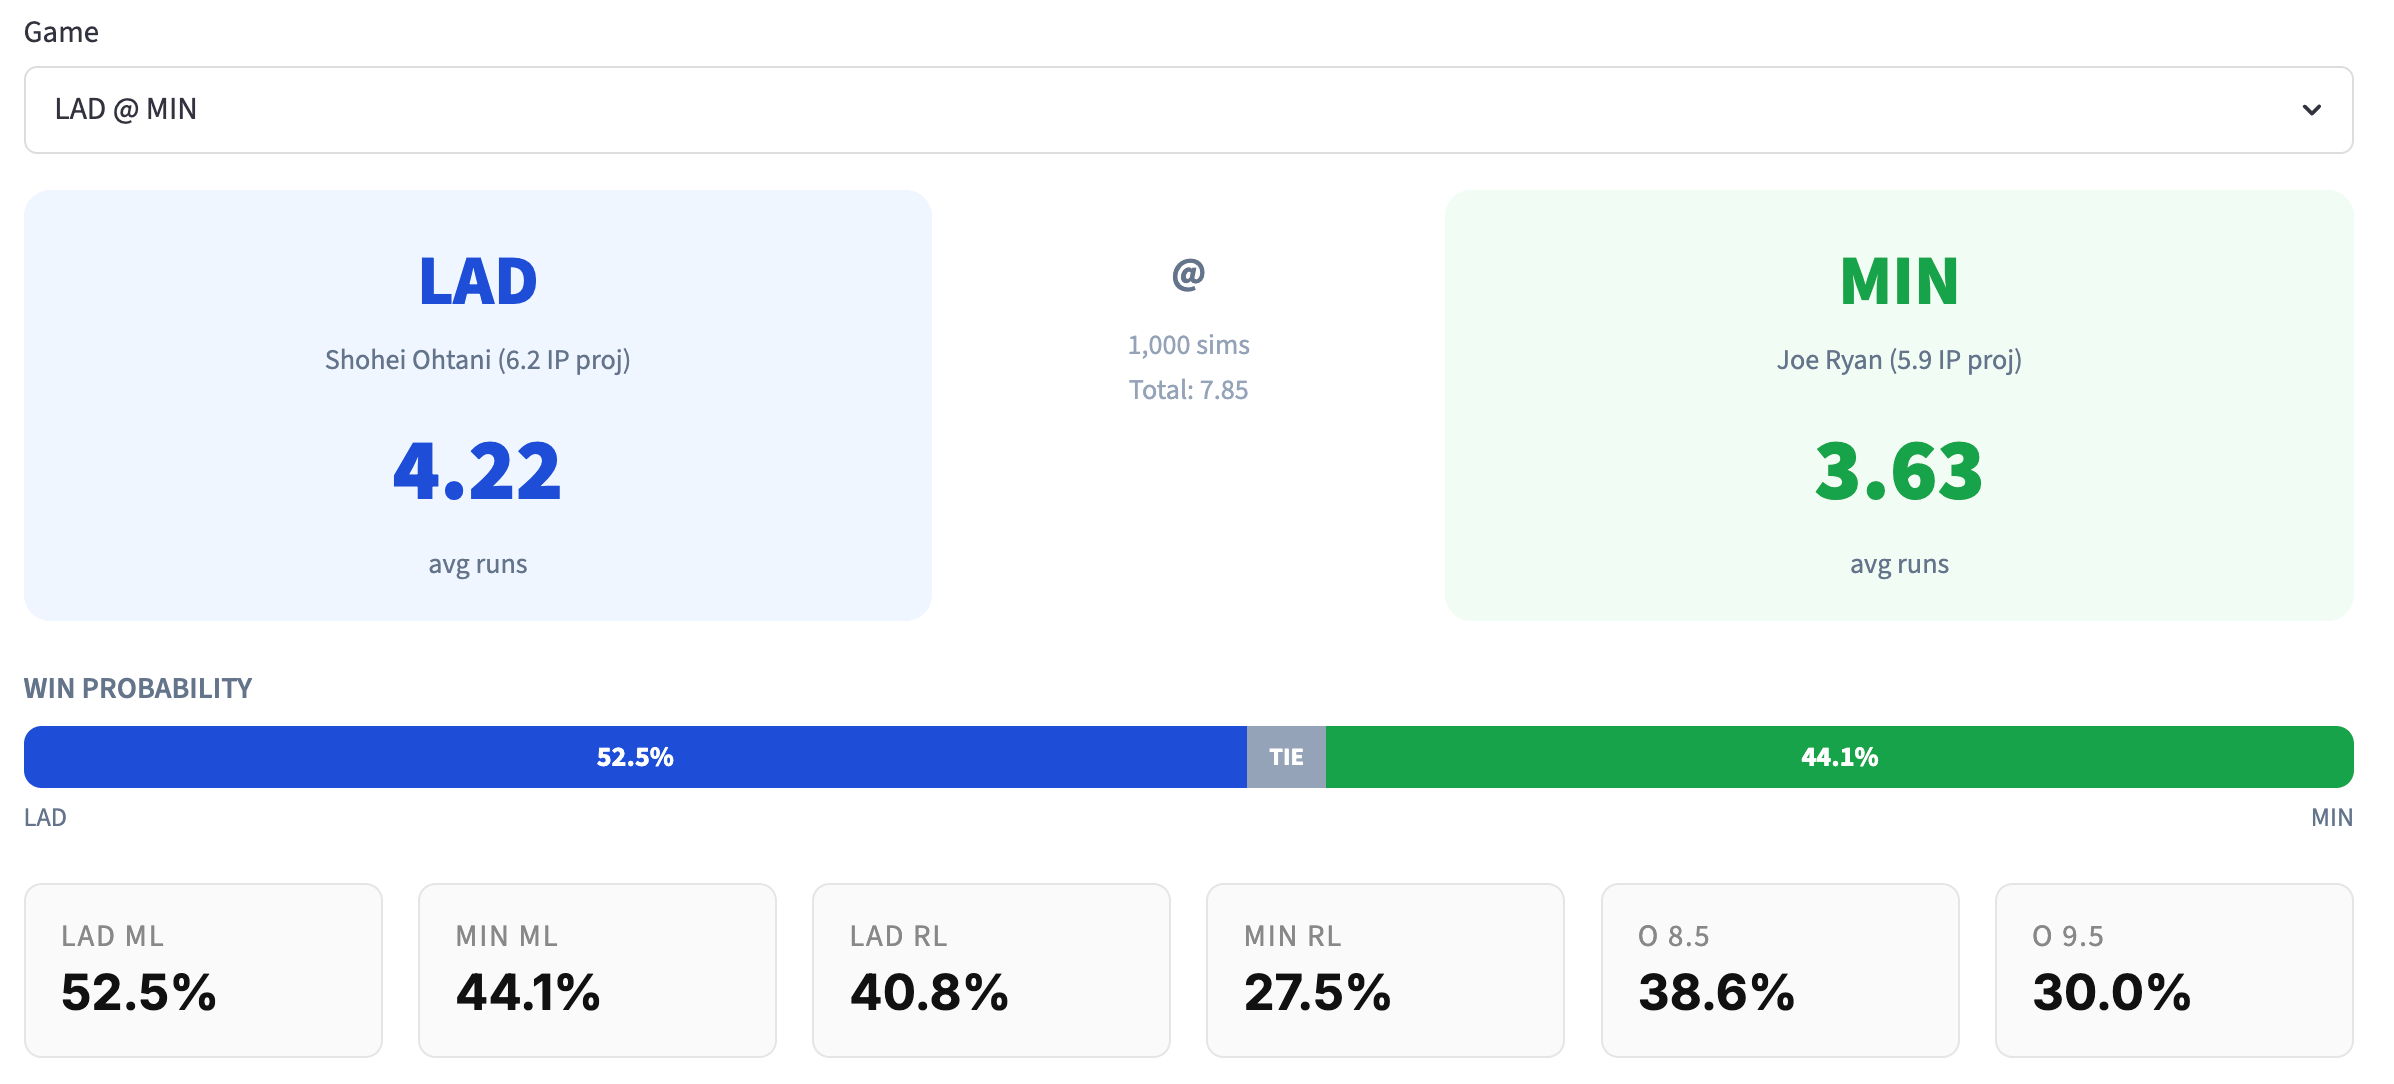
It shows avg runs per side, the starting pitcher with projected IP (Ohtani 6.1 IP, Joe Ryan 5.8 IP), win probability, and the full Over/Under by Line table. The projected IP matters for pitcher ceiling, more innings means more strikeout opportunities and a better shot at the win. The win probability bar gives you the cleanest read on the win bonus. Use this tab to finalize which side of a game you stack and whether the bring-back is worth a roster spot.
How the sim picks cash versus tournament plays
Cash. Sort DFS Leaders by Sim DK. Take the high-floor, high-median plays. Confirm pitchers with a win% above 55% on the Slate Summary so the win bonus is likely. Build around the safest run environment, not the highest total.
Tournaments. Sort by Ceiling (90%) for raw upside, then cross-reference Diff for leverage. The best tournament play has a high ceiling AND a high positive Diff, meaning big upside, the field is underrating because they’re anchored to Proj DK. Stack the teams with the highest Away R or Home R on the Slate Summary, and use the O-line percentages to decide bring-backs.
Subscribe and give it a spin! Or wait until FREE CONTENT FRIDAY and try it out for free.