
H+R+RBI Correlation Table
Investigating lineup spot correlation in the hits + runs + rbi market.


I wrote a DFS Strategy Guide piece here a while ago. In that piece, I went over lineup spot correlation. It occurred to me again today, and I figured I’d look into that again.
But this time, we’ll talk about the Hits + Runs + RBI market in player props. We’ve already covered DFS, and there’s some interest in player props here, so we’ll take that to prove our point.
What I’ve done here is I have gone back to 2021 and found the correlation coefficients for each pair of lineup spots when considering each player’s hits + runs + RBI total for each game.
Here’s the table:
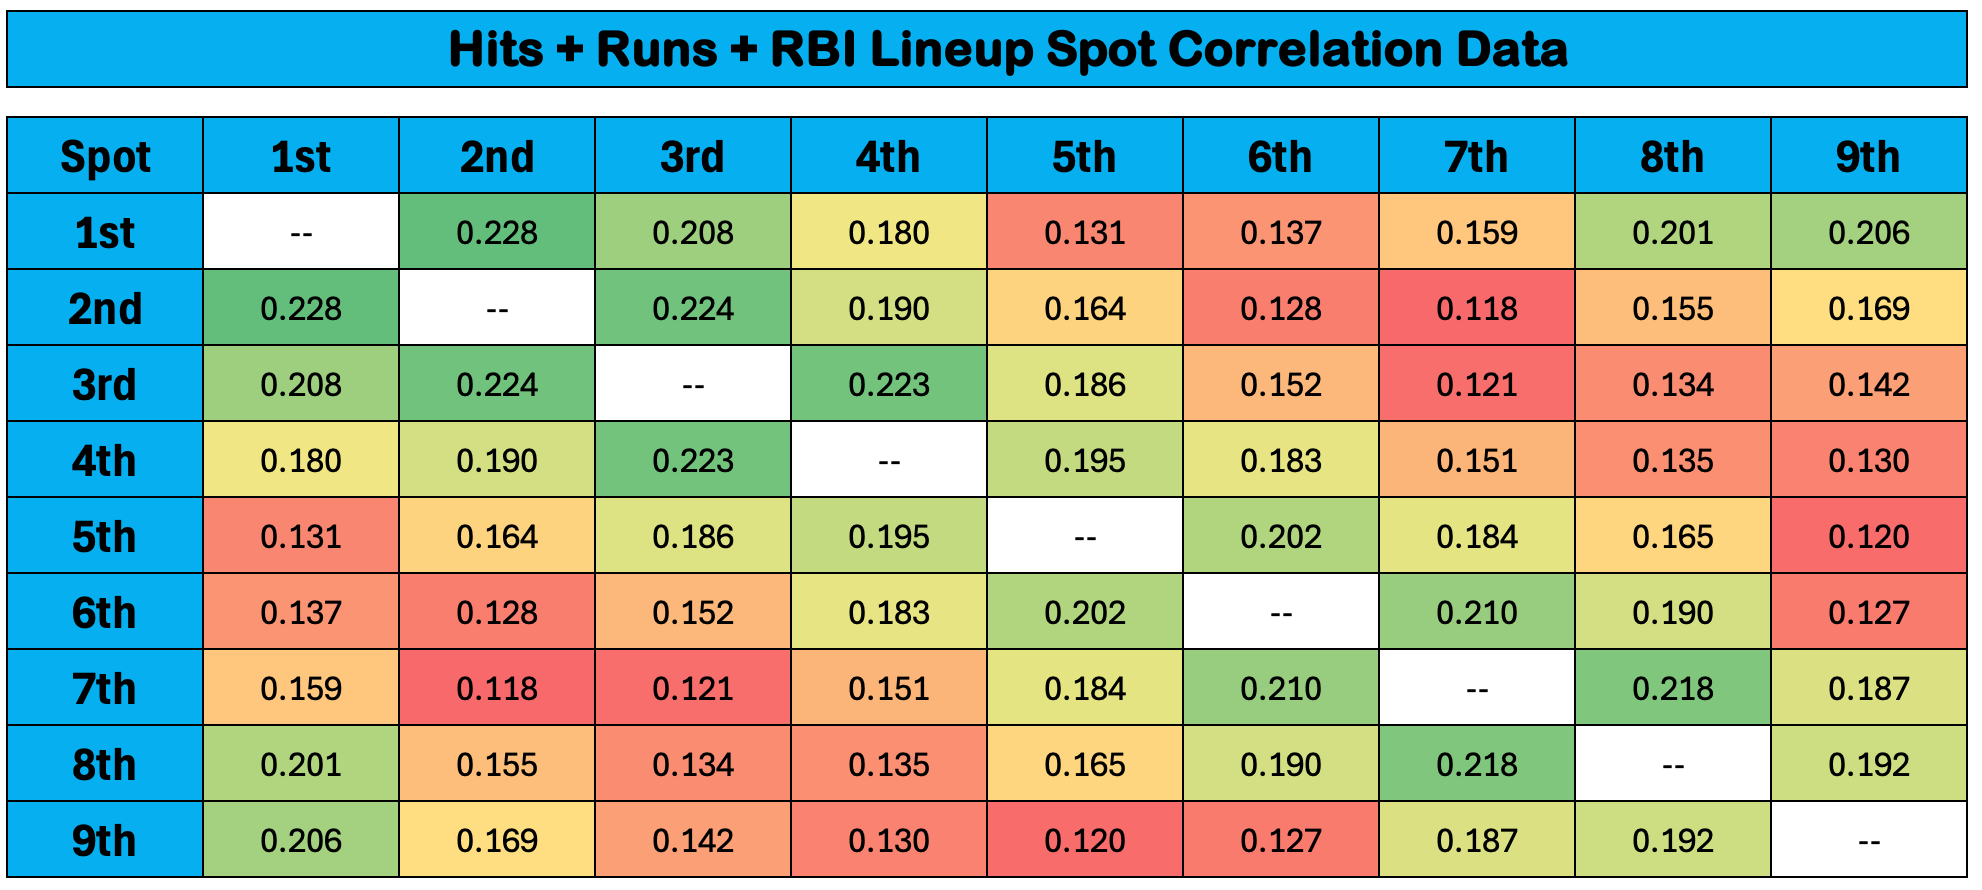
I don’t have too much more to add here. The higher the number and the greener the box, the more those two players are correlated in their H+R+RBI production.
The highest mark we find here is the lead-off man and the #2 hitter at .228. That is significantly above the second highest (2nd and 3rd at .224). The third highest is the 3rd & 4th hitters, and then there’s a pretty large fall-off after that.
The reason for that is the first inning. The #1, #2, and #3 hitters all hit in the first inning, no matter what happens. You cannot say that about any other duo or trio of hitters. There is no other inning where you can guarantee a certain pair of spots in the lineup will come up. We only know for sure what will happen in the first inning, and that strengthens the correlation among the first three spots. A 1-2-3 first inning only happens about one-third of the time, so the most common first inning sees the first four hitters all come to the plate.
As you get deeper into the game, there is less and less consistency in which batters are up in whatever inning, and that explains the reason why, say, the #6 and #7 hitters aren’t as strongly correlated as the #1 and #2.
The #7 and #8 hitters have a surprisingly high correlation. That correlation is well above the correlation between the 4th & 5th. This also has to do with the first inning. The #7 and #8 hitters come up in the same inning more often than the #5 and #6 do because that first inning often ends with the #5 man, while the first inning rarely gets to the #7 guy. So the #7 and #8 can come together in the second inning or the third inning. Both of those things are somewhat common.
What’s the takeaway here? Well, not much at all if you’re not a hardcore DFS stacking player or a sports bettor. But for those of you who are into those sorts of things, there just might be a little bit of an edge here, parlaying H+R+RBI together based on lineup spot.
That said, I’m sure the sports books adjust their parlay odds for this kind of thing. However, it would be worth studying that to see. I doubt they’re baking that sneaky little 7 & 8 correlation into it. So maybe you go ahead and parlay some 7 and 8 hitters together and see what happens. Let me know how it goes if you go forward with any of this information. Just wanted to share the table out since I took the effort to get the data!