Introducing MLB DW Pitch Grades
A new algorithm to grade individual pitch types!

I wake up every morning thinking “man, there really aren’t enough numbers in sports analytics these days, we really need to come up with a bunch of new ways to reduce human beings to numbers so we can judge, grade, and rank them”.
That actually wasn’t the first thought I had this morning. It was like the 17th. But I haven’t had a new thought since I had that one. And this particular thought was that I should come up with a model to grade individual pitch types.
We have all sorts of numbers on the dashboard about individual pitch types already.
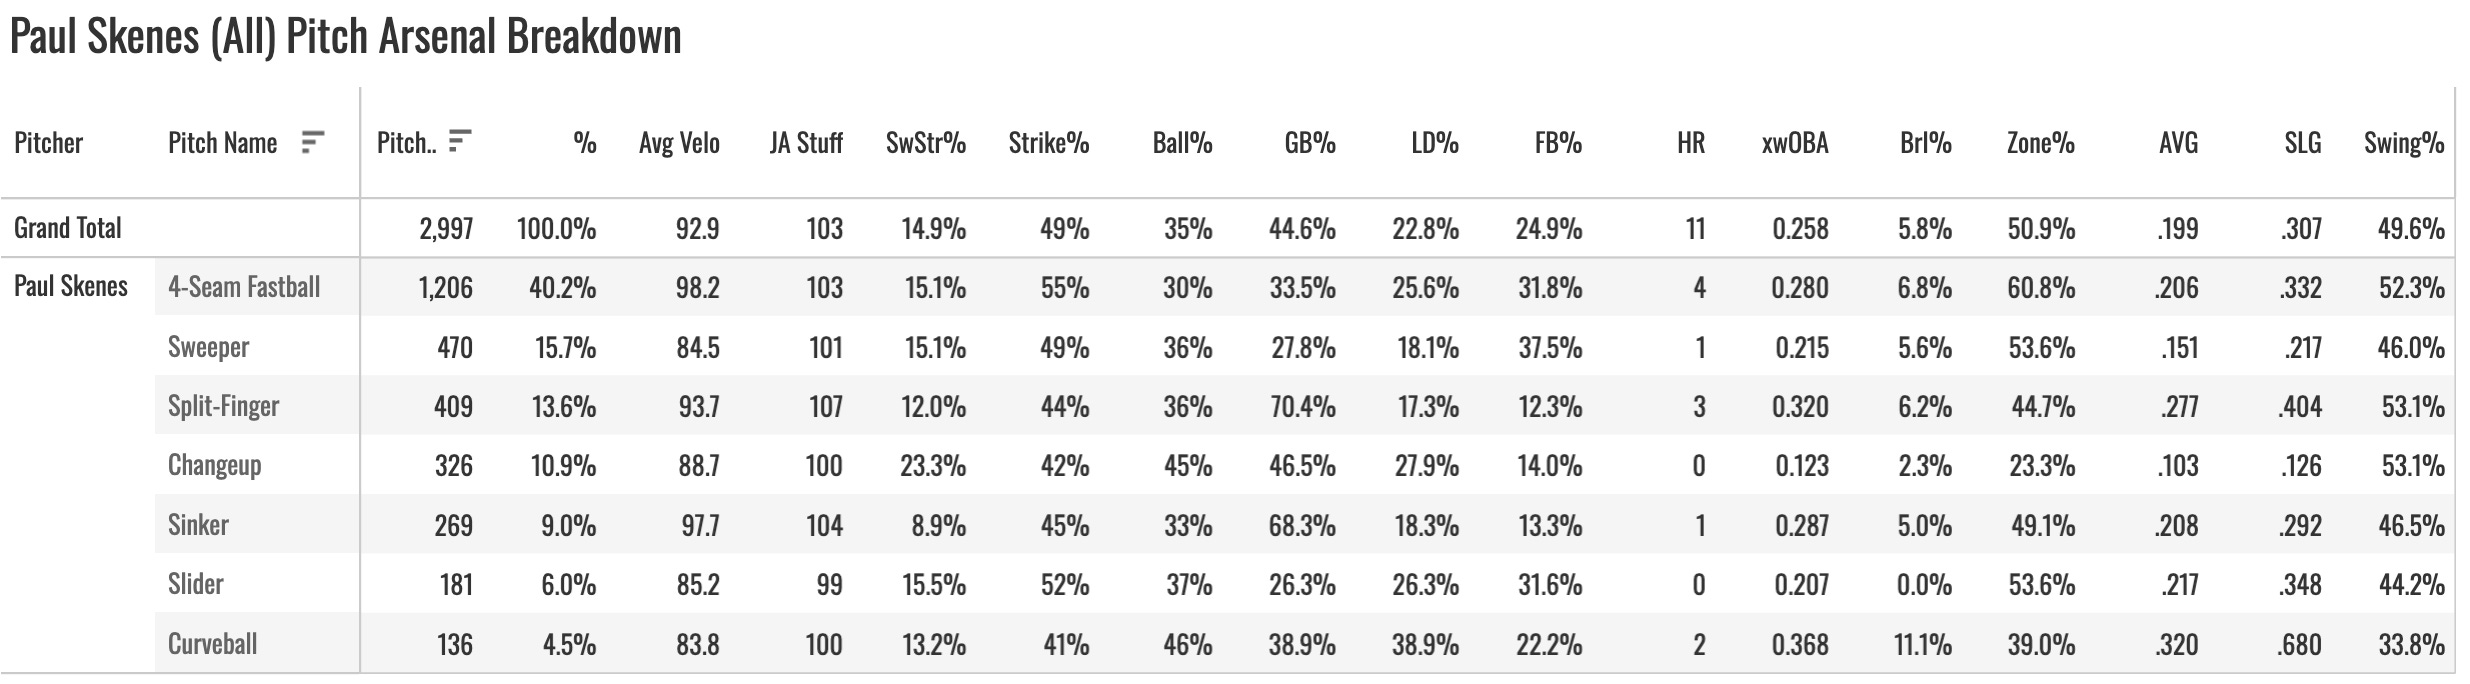
The table is WIDE, and that’s after I trimmed it down so it could at least fit a laptop screen. Forget about a smartphone. Your three-inch wide screen has no chance; better get your horizontal scrolling thumb loosened up.
But as of this morning, there’s a new number on there. It’s called GRADE. And it’s the result of the new model I’ve cooked up this morning. I did it all before my wife even got out of bed. If she only could understand the gravity of the things I am able to accomplish on this computer from 7:15-8:15am on Saturday mornings when she is sleeping in. She seems to like me just fine as is, but wow, just imagine if she could fully comprehend xwOBACON data modeling.
The model takes these inputs
→ SwStr%
→ Strike%
→ Ball%
→ xwOBACON (expected wOBA on contact)
→ Stuff+
It weighs all those together in the way I deemed appropriate, and it also weighs it on the usage of the pitch, to take a little bit away on a pitch that the pitcher hasn’t shown much confidence in.
So it’s a results-based stat, besides the Stuff+ input. I think pitching analytics has gone way too far in ignoring actual results. You can have the world’s nastiest pitch, but if you can’t control it, it’s no good. So this stat accounts for both. It looks at everything that matters to me.
That means we have the small sample problem. The grades won’t “stabilize” until you’ve thrown at least a couple hundred of each pitch type.
Let’s show it! You’ll find these grades on two dashboard tabs
Arsenals
Pitcher Profile
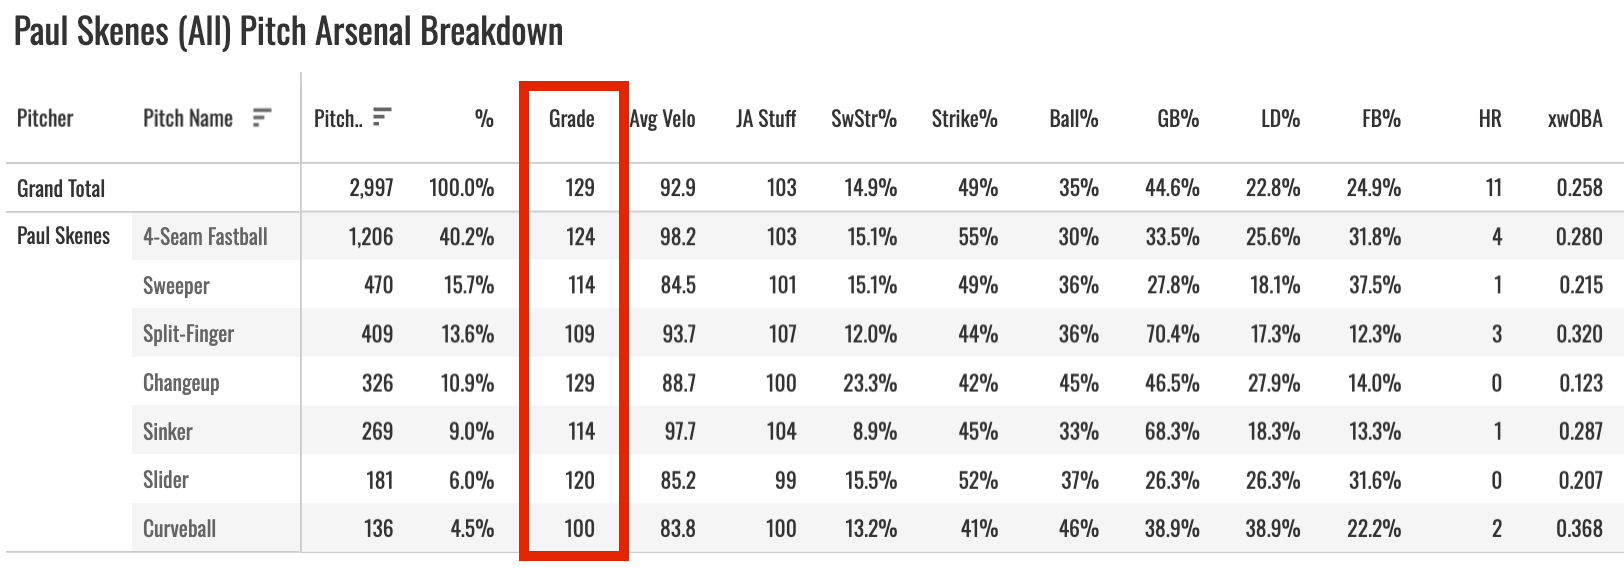
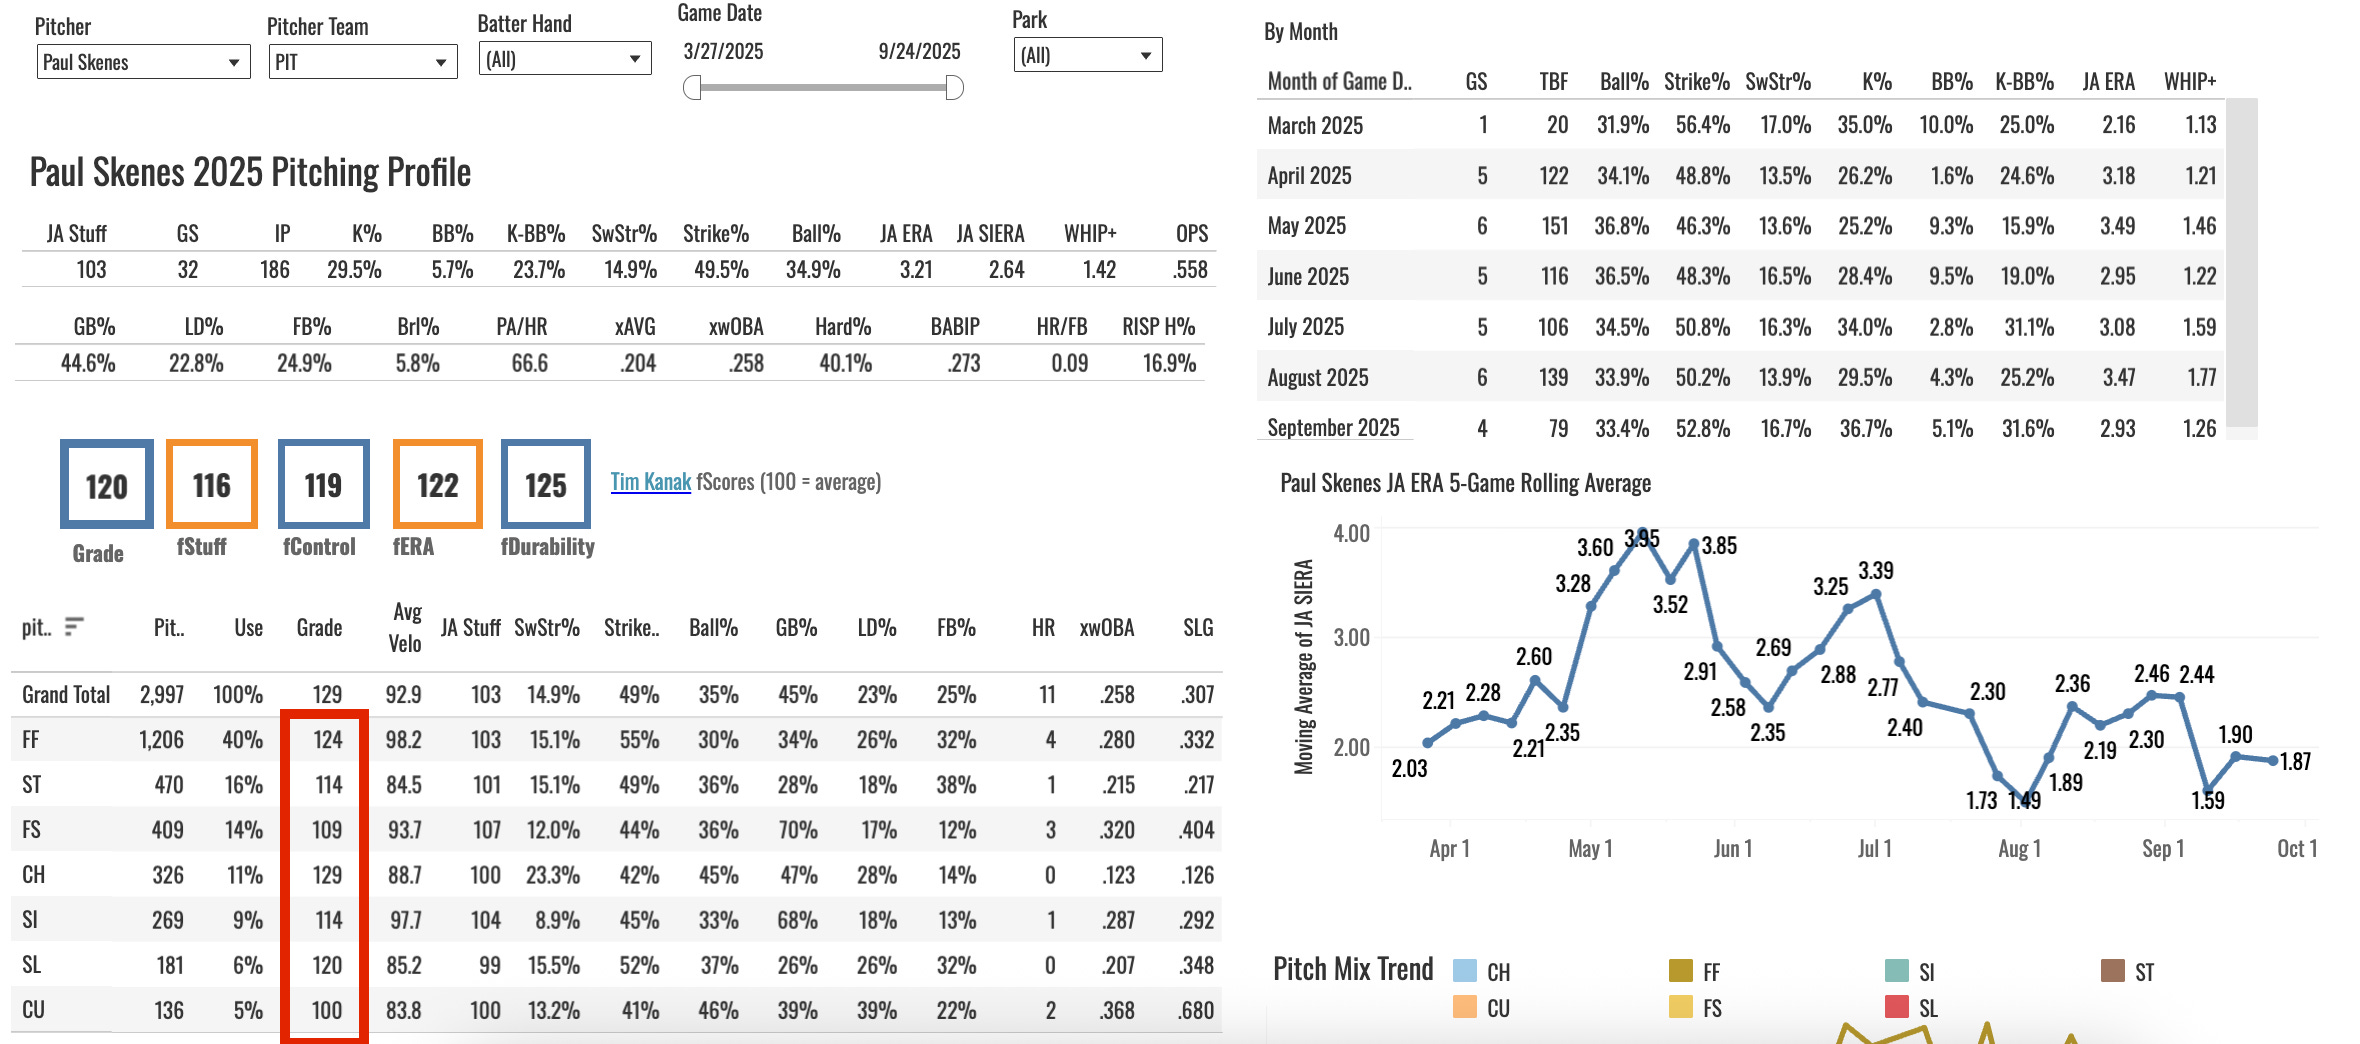
Ignore the “Grand Total” row, that will just be the max value from below. It doesn’t look at all of the pitches. I could explain the technical side of why that is, but I doubt anybody cares.
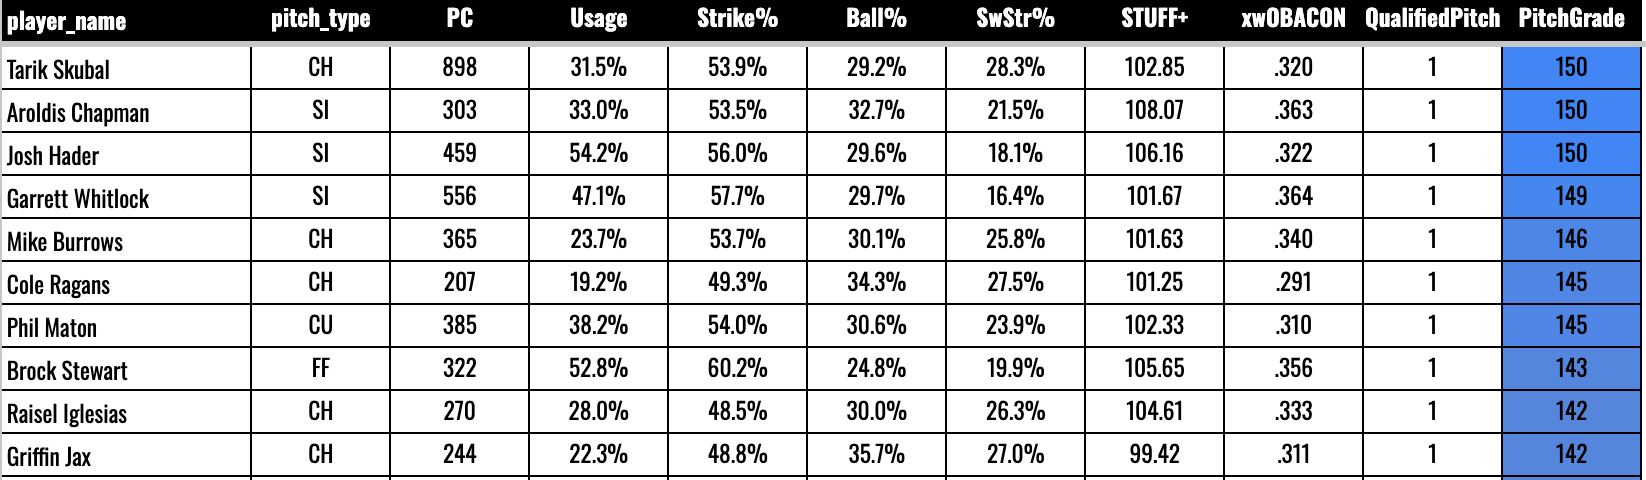
100 is the average, the max is 150, and the min for 2025 ended up around 70. Here are your ten best pitches:
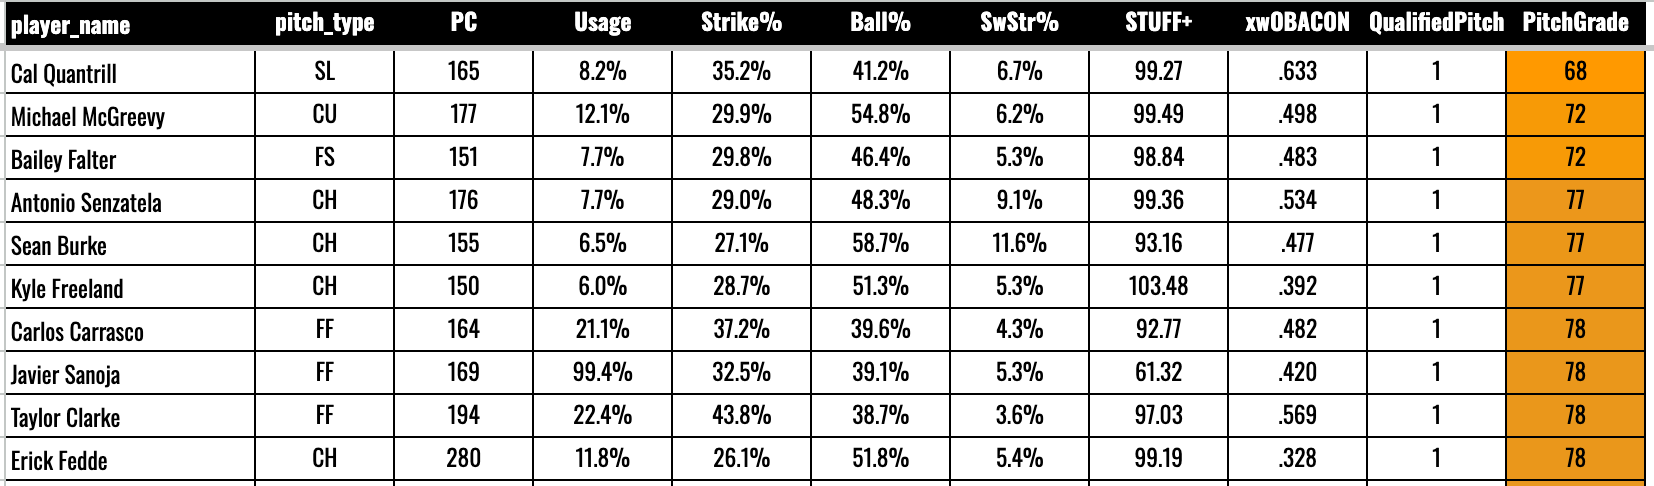
And your ten worst:
One guy that stood out while I was doing it was Connelly Early, but this shows you the small sample problem. Homey has a perfect 150 grade on his sinker!
106.8 Stuff+ (crazy high in my model)
17.1% SwStr%
59% Strike%
22% Ball%
Those are all super-elite numbers, but he threw all of 41 sinkers. If he comes out in his first start next year and throws like a 39% Ball% and gives up a dinger on the sinker, the grade would fall a long, long way.
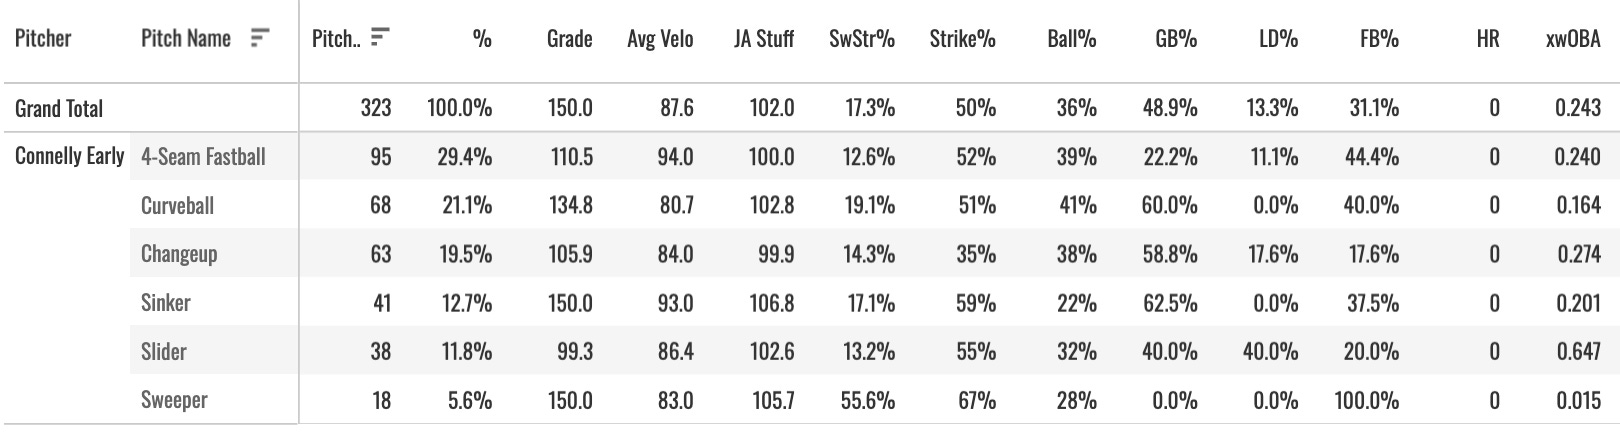
I wouldn’t take the grade seriously until you see 200+ pitches thrown.
It should be fun to look at, and it should enhance our pitcher analysis. I’ll certainly be citing this stat a bunch in the team previews and other stuff moving forward.
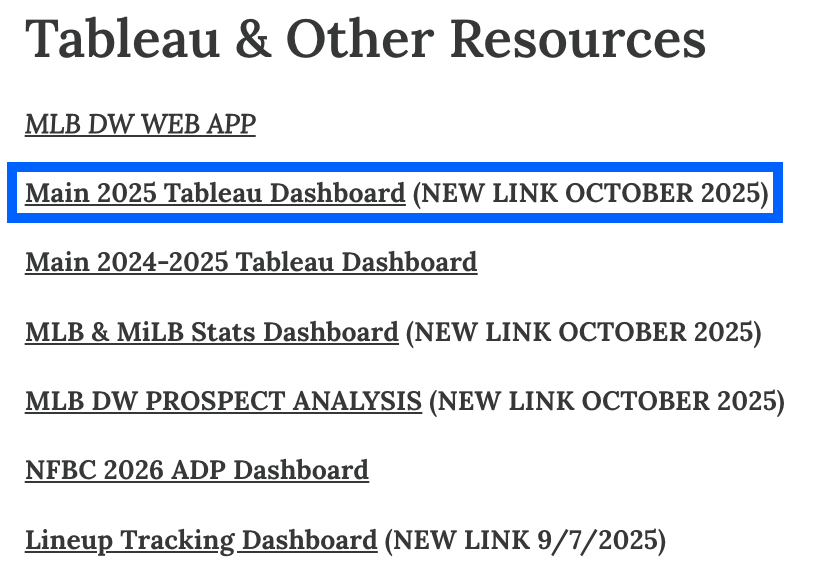
It’s all housed on the main dashboard, which paid subs have access to through the Resource Glossary.