
Investigating Team Defense and Its Impact on Pitching
A look at OAA and its affect on pitcher results

Quick hitter here! The thing that gets most overlooked in the fantasy baseball game is defense. And that’s because defense doesn’t matter! At least not directly. There are no defensive categories that make a difference in the standings of the league.
But the better players will factor in defense to their pitcher projections and ranks.
It’s very logical: better defense = better pitching results.
The most popular way these days, at least as far as I can tell, to measure defensive “production” is outs above average. This measures how many outs a fielder converted above/below what we think the average fielder would have done. You can sum them all up for each team and get a total for each season, and then you can judge defensive teams that way. Here are the numbers from last year:
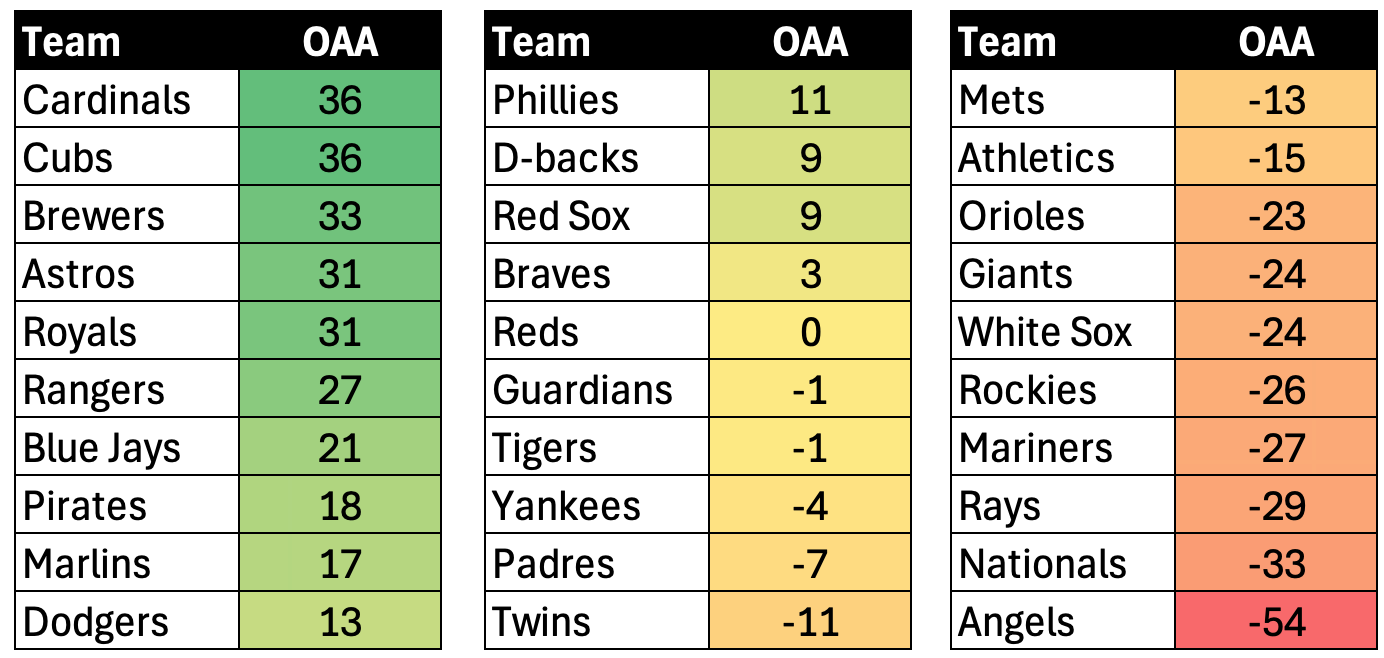
So the Cardinals and Cubs were the best defensive clubs, an incredible 90 runs above the worst unit over there in Anaheim.
The next question is - DOES IT MATTER? It would be simply unbelievable if I told you it doesn’t. It must matter. Turning batted balls into outs is a very good thing for a pitcher. But how do we measure it? Well, I found one way!
My theory was that the good defensive teams should create bigger, more positive gaps between ERA and SIERA for their teams. The inputs that go into SIERA are:
K%
BB%
FB & HR stuff
Defense has nothing to do with those three things, which is the entire point of the SIERA-type stats.
SIERA = Skill Interactive ERA
FIP = Fielding Independent Pitching
The whole idea behind these stats is to strip out defensive performance and just isolate the things the pitcher was in control of.
So yes, if OAA is a good measure of defensive abilities, it should correlate with the gap between ERA and SIERA. But I wanted to check to be sure!
Here it is! The answer in scatter plot form:
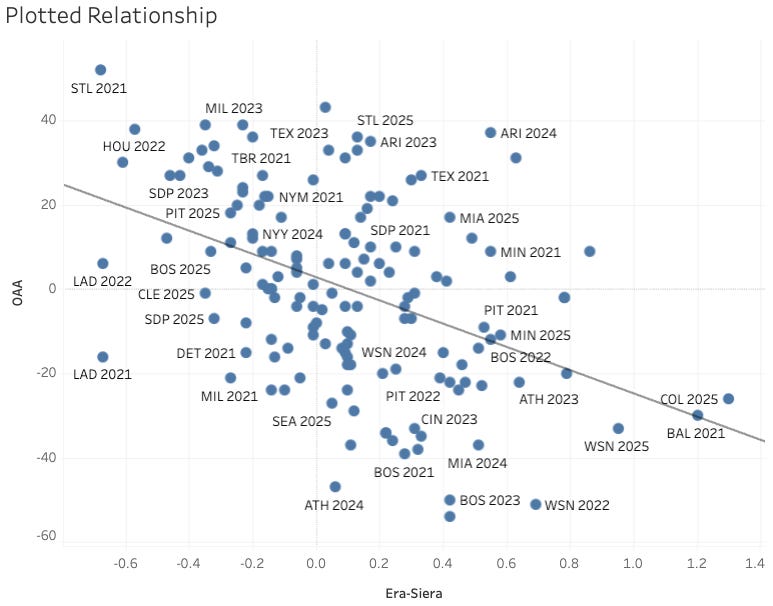
The downward slope of the trend line tells us that there is indeed a relationship here. The more OAA you add, the bigger the gap between ERA and SIERA. Pitchers with good defenses behind them are more likely to beat their indicators.
That is not a surprise! But you might notice that it’s not the steepest line in the world. Here’s that relationship given in the language of statistics:
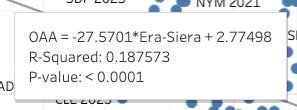
In plain English (plain English written by Chat GPT, I will do the ideas and the jokes, but I’ll let the AI do the math work for me, I think that’s fair):
As OAA goes down. ERA-SIERA goes up
(Because the slope is negative: OAA = -27.57 × Era-SIERA + 2.77.)It’s a real relationship, but not a super strong one.
The R² = 0.188 means Era-SIERA explains about 19% of the variation in OAA — so there’s still a lot of scatter/noise from other factors.It’s statistically significant.
The p-value < 0.0001 means this downward trend is very unlikely to be random chance.
Bottom line: worse (higher) Era-SIERA is associated with worse (lower) OAA, but it’s only a moderate predictive link.
Nine teams in the last five years have gone for an OAA above 35. And four of them significantly crushed their SIERA.
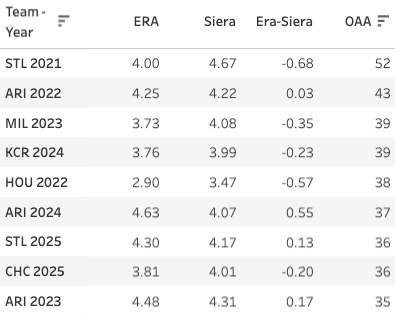
But it didn’t work every time! The Diamondbacks are here three times with great defense, and all three times they failed to beat their SIERA. That’s weird.
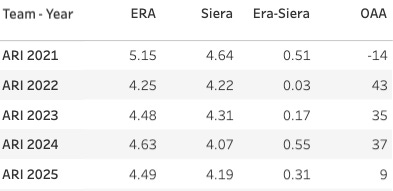
They must be cursed or something. Yeah, let’s go with that. We need a good mixture of solid statistical work and superstition on these pages.
The worst defensive teams of the last five years:
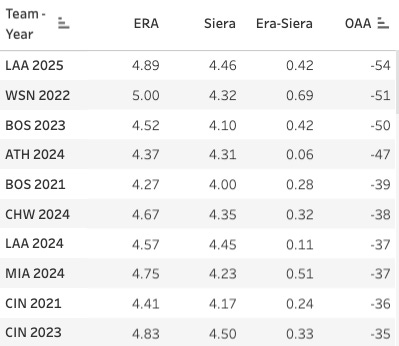
You don’t see a single team beating their SIERA on this list.
The full data and that plot are here if you want to explore it yourself.
So then the next question is, what teams have the best defenses for 2026? Which pitchers should we be slightly upgrading or downgrading because of the defense behind them? I had some help from the guys in the Discord, and we put together everybody’s projected defensive lineup and then I merged in 2024-2025 OAA data to get a rough idea of how good each team will be in 2026. Here’s how it looks:
Elite Defenses
Cubs
Royals
Brewers
Red Sox
Diamondbacks
Above Average
Braves
Astros
Yankees
Blue Jays
Guardians
Phillies
Average
Reds
Cardinals
Mets
Padres
Rangers
Tigers
Nationals
Athletics
Pirates
Dodgers
Mariners
White Sox
Below Average
Rockies
Rays
Orioles
Really Bad
Twins
Giants
Marlins
Angels
So there you go, you can keep that stuff in mind when drafting pitchers. I’d use it as more of a tiebreaker than a big difference-maker, but it’s good stuff to know.