The Daily Notes are the flagship resource of MLB Data Warehouse. Every morning, Jon breaks down the current goings on in the fantasy baseball world, and an automated daily report gets you up to date on key stats and trends. Become a paid subscriber at MLB Data Warehouse to get this unlocked in your inbox every morning!
IT’S FREE CONTENT FRIDAY! Most things are FREE for all today. Hit up the web app and use “friday” as the password, and enjoy all of the projections, tools, and other goodnesses!
I’m in the fight of my life against dandelions right now. I have this neighbor two doors down, it’s a family with nine kids, so they don’t exactly have the time to take care of their lawn and stuff. So their lawn is loaded with dandelions, which is actually fine, it doesn’t look all that bad.
I don’t care much about anything aesthetic, but for whatever reason, I really hate weeds. I actually do think weeds are demonic, in some way. I’m not saying they’re all actual embodied demons, I’m just saying they’re a consequence of original sin and the fall of man. There were definitely no dandelions in the Garden of Eden.
Back to my neighbor though, I blame them for the problems I’m having. There must be 10,000 dandelions in their yard, and each one of those asexually reproduces exponentially, right? At least like ten dandelions come from one dandelion. Somehow, the neighbor in between us has zero dandelions. I’m not sure how they’ve pulled that off. I should ask them. It’s a very old, retired couple, so I need to learn from the wisdom of their years.
Eric Lauer vs. ARI
Chris Bassitt vs. CLE
SATURDAY
Luis Severino vs. CWS
Dean Kremer vs. CLE
SUNDAY
Reid Detmers vs. SD
Mike Burrow vs. STL
David Peterson vs. CHC
I did this post on X yesterday where I calculated SIERA for HITTERS. And by that, I mean, I took each plate appearances’s result, applied that to the hitter in the plate appearance, and then calculated what the SIERA would be. Nobody has ever done this before, because it’s not a very useful or clever thing to do. But I did it.
SIERA AGAINST LEADERS
Apply the SIERA folder to hitters instead of pitchers, find out which hitters have been most effective in a new and kinda funky way:
Bests:
1. Yordan Alvarez 6.16
2. Austin Martin 6.09
3. Kevin McGonigle 5.91
4. Carson Kelly 5.78
5. Luis Arraez 5.75
6.
5:00 PM · Apr 16, 2026 · 6.73K Views
2 Replies · 21 Likes
What it basically will turn out to be is a list of the biggest hitter K% and BB% differentials.
SIERA’s inputs are K%, BB%, and fly ball stuff. The three things that a pitcher controls most.
Yordan Alvarez has an 11% K% and a 20% BB%. If a pitcher had that mix going on, his SIERA would be over six. And that’s where we get that 6.16 mark on Yordan.
But I was surprised to see Austin Martin second. I guess I wouldn’t have been surprised if I had been looking at his stats this year. Becuase this isn’t a complicated formula.
→ 15.4% K%
→ 23.1% BB%
→ 50% GB%
Martin has this combination going on:
→ 31.5% Swing%
→ 91.8% Zone Contact%
And that’s a very good recipe for a high walk rate and a low strikeout rate. He takes a ton of pitches, and then is able to get the bat on the ball when he does swing at it. It’s not automatically good for fantasy leagues, though. You want that to combine with actual power or speed. Martin’s power indicators:
→ 6.7% Brl%
→ 10th percentile bat speed
→ 102.6 max EV
→ 23% FB%
→ 23% Air Pull%
Not good at all on the EV stuff, and it doesn’t look like it’s going to come up very much.
He does have a 22% stolen base attempt rate with two steals so far, and 70th percentile sprint speed.
He’ll have plenty of opportunities with that walk rate. But pitchers might just catch onto the fact that he’s not really a home run threat and he likes to take pitches, and they might just start throwing the ball right over the plate to make sure they don’t walk the guy.
That’s what I’d do. There’s really no reason to walk a guy with low bat speed and high foot speed. A walk is mostly as bad as a single for a pitcher. You’re cool with walking Aaron Judge, because that means he didn’t homer, but Austin Martin is rarely going to be putting extra bases on you, and his stolen base ability means you might be handing the opposing a team two bases with a walk.
Points leagues, he’s a sneaky target. Everywhere else, I can’t really recommend it.
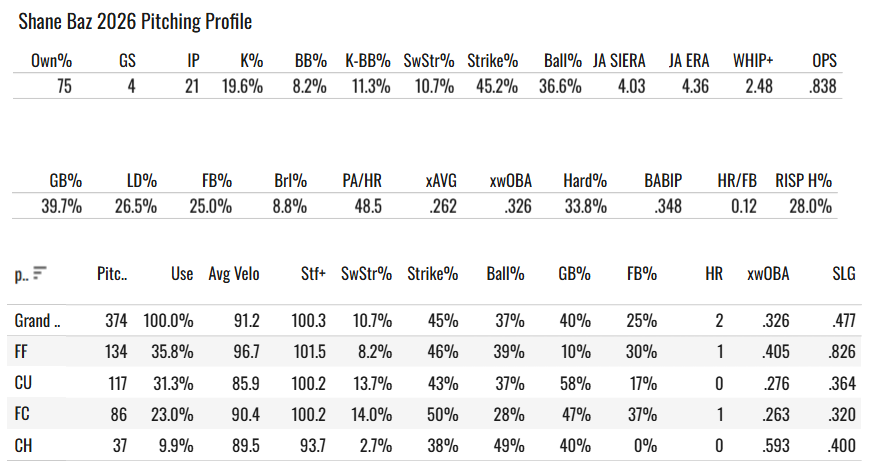
I’ve been wondering if I should drop Shane Baz.
6.0IP 6H 4ER 4R 6K 3BB
I have never liked the guy. He’s been the poster boy of the money ball conundrum. The STUFF models always love him, but he’s never actually put up good numbers.
If he’s a good pitcher, why doesn’t he pitch good?
I bought in for my home league because the high stakes auction guys were spending significant money on him. So I trusted them and not my own prejudice. And this is what happens when you ignore your own prejudice!
Shane Baz SIERA by Year
2024: 4.39
2025: 3.95
2026: 4.32
It has never been good! We thought he could be helped out by getting out of that minor league stadium he had to pitch in last year, but that doesn’t turn out to matter when you have an 11% K-BB%.
The 10.7% SwStr% with a 36.6% Ball% and a 40% GB%. He’s doing nothing well. The fastball could be better if he gets his usual decent command back with it, I guess. He also hasn’t thrown the curveball for strikes yet. That’s his alleged best pitch.
I would definitely be cutting him for a Jose Soriano, Mick Abel, Emerson Hancock, Landen Roupp type guy. But I might give him 2-3 more starts just to see in those leagues where your replacement options have no real upside.
Landen Roupp’s good season continued in Cincinnati.
6.0IP 1H 0ER 0R 6K 2BB
The whiffs weren’t there (8% SwStr%, 44% Strike%, 44% Ball%). In a lot of ways, this was his worst start. But one hit and no runs through six innings, you’re not going to complain about that.
For the year:
26.7% K%
7.8% BB%
10.5 SwStr%
44.9% Strike%
39.4% Ball%
53% GB%
2.82 JA SIERA
4.14 JA ERA
He hasn’t allowed a single homer. He’s allowed a .501 OPS, and he’s been helped by a .260 BABIP.
The underlying stuff really suggests this is mostly fake. BUT he’s four starts in now, and he’s allowed zero or one run in three of those. He’ll face the Dodgers next, so it’s easy to just leave him on waivers for next week. But we’re keeping an eye on him, because the 2.38 ERA and 0.97 WHIP have been sparkling so far.
If you have him, and can get something useful for him, I’d go ahead and do that though, because the strike-earning metrics are very bad here.
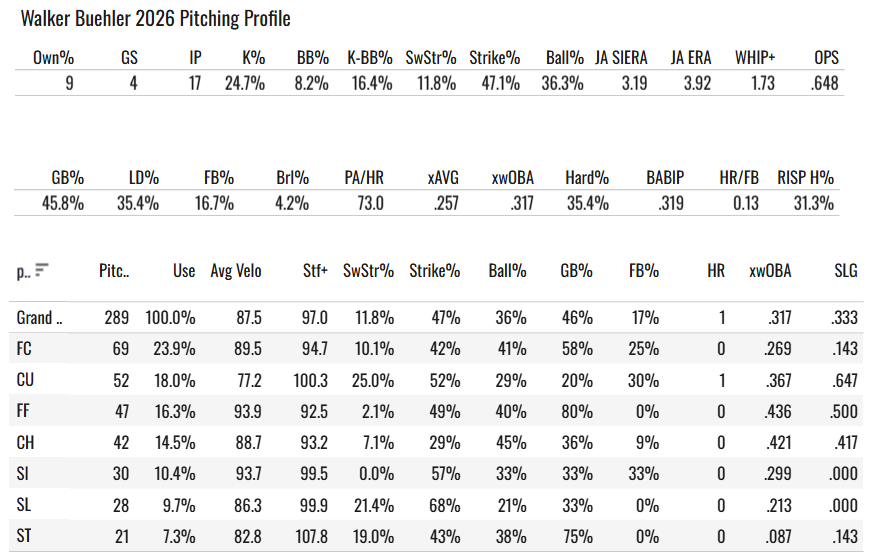
Let’s give a look to Walker Buehler. This guy was a non-roster invitee to spring, right? And now he’s made four starts for the Padres with a 4.58 ERA and a 1.25 WHIP. That ERA is bad, but the 24.7% K% and 8.2% BB% with 0.51 HR/9 is quite good.
He sports one of the lower SIERAs you’ll find among widely available pitchers. The 46% GB% is interesting, and look at how long the list of pitches is. That’s seven pitches above 7% usage, and five above 10%.
None of the pitches look good by the modling, but we say it all the time, seven bad pitches are a lot better than 2-3.
I’d be a lot more willing to buy in if he hadn’t put up a 10.5% K-BB% in 2024 and then a 5.5% mark in 2025.
His last two starts have been good (11:1 K:BB), but it was a 7:5 in the first two starts. Probably just a bit of luck in these last two. It’s been a long time since Buehler has been good. And that’s a bit sad for him, because he was one of those generational pitching prospects back in 2018 or whatever it was. Before all of the injuries. I remember watching his debut and being amazed that a starter was pumping 100. And now that’s like 15% of the league!
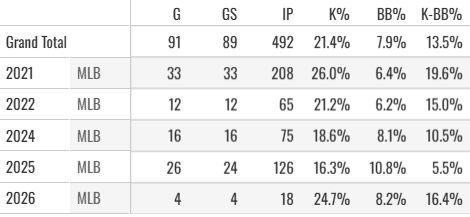
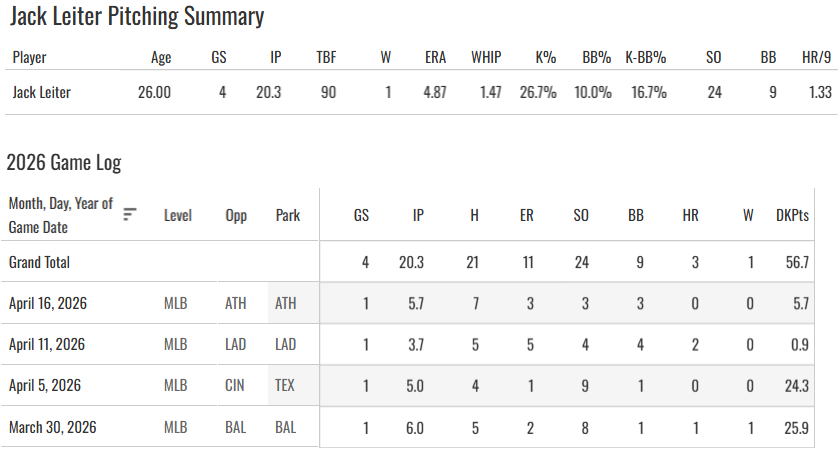
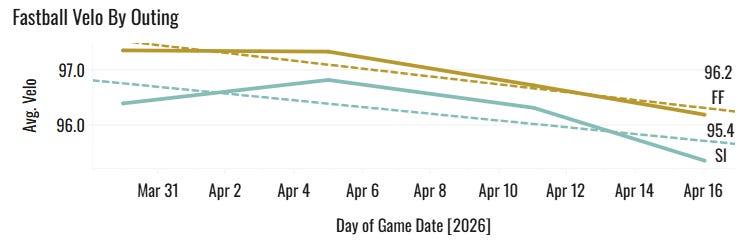
Let’s check back on Jack Leiter. Suddenly his ERA is up to 4.87 and his K-BB% is down to 17%.
After a 17:2 K:BB start, he’s at 7:7 the last two. Gross! His SwStr% and Ball% by start:
→ 3/30: 23% SwStr%, 35% Ball%
→ 4/5: 21% SwStr%, 35% Ball%
→ 4/11: 9% SwStr%, 42% Ball%
→ 4/16: 7% SwStr%, 36% Ball%
The fastball velo has gone down as well:
So that’s not the progression you want to see! I believe we called him a sell high after his second start, if you did that - you’re feeling pretty good. I’m sure there will be good starts to come, but through four starts we have that same frustrating low floor we’ve had his whole career to this point.
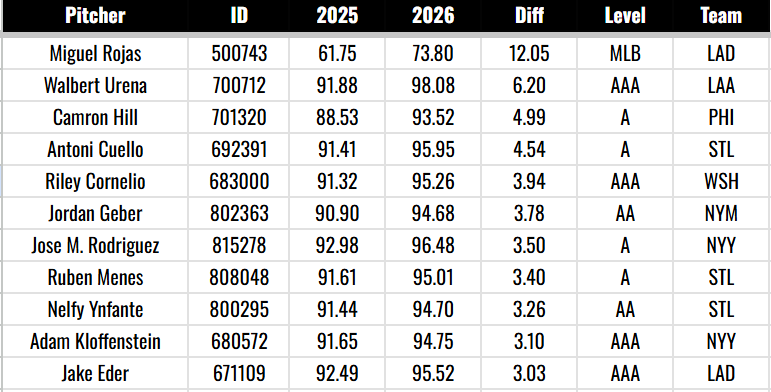
I checked four-seam fastball changes for all professional levels of baseball. This might help some of the dynasty people out.
There are 11 pitchers who have kicked up the four-seamer by at least three miles per hour this year, compared to 2025:
Miguel Rojas wow! +12mph! That guy is an infielder, in case you didn’t realize it.
Walbert Urena is here at +6.2. He doesn’t throw many four-seamers though, and he’s a bullpen guy at best for the Angels, so we’re not really interested in him for any srot of normal fantasy leagues.
Look out for this Riley Cornelio guy. He’s a 26-year-old Nationals pitcher. He made 26 starts with 134 innings last year with a 25% K% and a 10% BB%. Not bad! This year, with that extra velo, he has a 35% K% in AAA. The Nats could certainly use some pitching help.
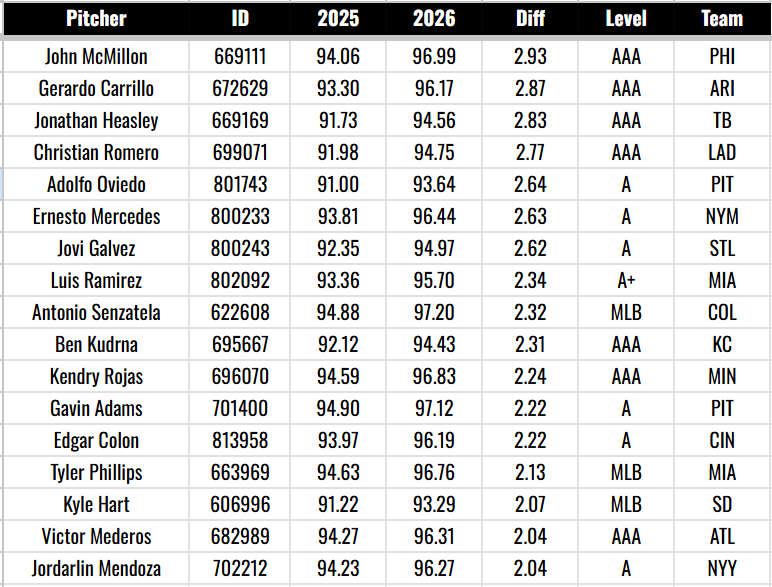
More dudes at 2-3mph increases:
There are a lot of relievers in here. There’s probably not much fantasy baseball implication. But I figured it would be fun to check.
The full data is here if you want to see everybody’s comparison for 2025 to 2026 at any level where the data has been captured in both years.
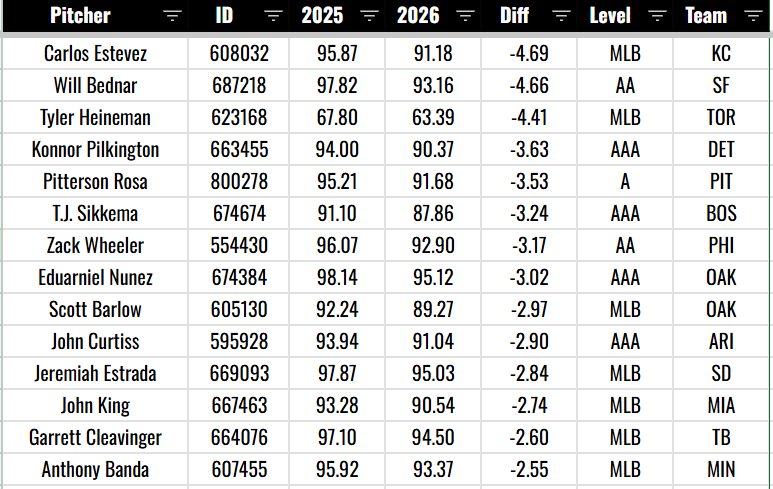
Here are the velo losers:
Carlos Estevez still at the top. It’s at least a little bit concerning to see Zack Wheeler here. We obviously would not be expecting his normal velocity in this rehab assignment. He’s still ramping it up and easing into things after the TOS surgery. His velo has gone 93.3→92.7→92.9 in his three starts, though, so it’s not an upward trajectory. I highly doubt he gets back to 97, but 94-95 might be perfectly fine for him.
We’ve gotta get these notes out! I have an idea for a “Stats You Should Know” post, that I’ll try to pull off. I want to look at some changes in hitter stats to see if we can spot some 2026 breakouts or busts. It’s about that time now about three weeks into the season!
1. Braxton Ashcraft
2. Parker Messick
3. Brandon Sproat
4. Jacob Lopez
5. Foster Griffin
6. Chase Burns
7. Walker Buehler
8. Patrick Corbin
9. Steven Matz
10. Keider Montero
11. Shane Baz
12. Landen Roupp
13. Ryan Weiss
14. Max Fried
15. Jack Leiter
16. Luis Castillo
17. Kris Bubic
1. Parker Messick (vs. BAL): 33.6 Points
2. Chase Dollander (vs. HOU): 32.19 Points
3. Landen Roupp (vs. CIN): 27.7 Points
4. Brandon Sproat (vs. TOR): 22.01 Points
5. Walker Buehler (vs. SEA): 21.65 Points
6. Patrick Corbin (vs. MIL): 19.76 Points
7. Chase Burns (vs. SF): 19.7 Points
8. Braxton Ashcraft (vs. WSH): 18.56 Points
9. Jacob Lopez (vs. TEX): 13.05 Points
10. Foster Griffin (vs. PIT): 12.59 Points
1. Parker Messick (CLE): 18 Whiffs (112 Pitches)
2. Braxton Ashcraft (PIT): 17 Whiffs (90 Pitches)
3. Foster Griffin (WSH): 14 Whiffs (89 Pitches)
4. Chase Dollander (COL): 14 Whiffs (86 Pitches)
5. Brandon Sproat (MIL): 12 Whiffs (75 Pitches)
6. Walker Buehler (SD): 12 Whiffs (88 Pitches)
7. Jacob Lopez (OAK): 12 Whiffs (85 Pitches)
8. Patrick Corbin (TOR): 10 Whiffs (79 Pitches)
9. Shane Baz (BAL): 9 Whiffs (99 Pitches)
10. Steven Matz (TB): 9 Whiffs (74 Pitches)
1. Chase Dollander (COL): 55.8 Strike%, 36.0 Ball%
2. Parker Messick (CLE): 55.4 Strike%, 30.4 Ball%
3. Braxton Ashcraft (PIT): 54.4 Strike%, 28.9 Ball%
4. Walker Buehler (SD): 52.3 Strike%, 34.1 Ball%
5. Foster Griffin (WSH): 49.4 Strike%, 32.6 Ball%
6. Brandon Sproat (MIL): 48.0 Strike%, 29.3 Ball%
7. Ryan Weiss (HOU): 47.4 Strike%, 40.8 Ball%
8. Chase Burns (CIN): 47.1 Strike%, 37.9 Ball%
9. Patrick Corbin (TOR): 46.8 Strike%, 36.7 Ball%
10. Steven Matz (TB): 45.9 Strike%, 31.1 Ball%
11. Shane Baz (BAL): 45.5 Strike%, 37.4 Ball%
12. Anthony Kay (CWS): 45.1 Strike%, 39.4 Ball%
13. Jack Leiter (TEX): 44.8 Strike%, 36.2 Ball%
14. Landen Roupp (SF): 43.7 Strike%, 43.7 Ball%
15. Jacob Lopez (OAK): 43.5 Strike%, 41.2 Ball%
1. Brandon Sproat: 75 Pitches, 20 Outs, 3.75 POUT
2. Keider Montero: 83 Pitches, 18 Outs, 4.61 POUT
3. Parker Messick: 112 Pitches, 24 Outs, 4.67 POUT
4. Landen Roupp: 87 Pitches, 18 Outs, 4.83 POUT
5. Steven Matz: 74 Pitches, 15 Outs, 4.93 POUT
6. Chase Burns: 87 Pitches, 17 Outs, 5.12 POUT
7. Patrick Corbin: 79 Pitches, 15 Outs, 5.27 POUT
8. Braxton Ashcraft: 90 Pitches, 17 Outs, 5.29 POUT
9. Chase Dollander: 86 Pitches, 16 Outs, 5.38 POUT
10. Shane Baz: 99 Pitches, 18 Outs, 5.5 POUT
Patrick Corbin’s FC velo (18 pitches) DOWN -1.5mph to 85.9
Anthony Kay’s FF usage (50.7%) up 15.9 points
Brandon Sproat’s FC usage (32.0%) up 17.7 points
Braxton Ashcraft’s CU usage (34.4%) up 10.7 points
Chase Dollander’s SL usage (12.8%) up 11.1 points
Foster Griffin’s SI usage (22.5%) up 12.8 points
Jack Leiter’s FF usage (51.4%) up 13.4 points
Luis Castillo’s SI usage (35.7%) up 13.8 points
Patrick Corbin’s FF usage (17.7%) up 14.3 points
Ryan Weiss’s ST usage (40.8%) up 11.3 points
Steven Matz’s SL usage (17.6%) up 14.0 points
Garrett Crochet - 43.0 RISP H%, 0.414 BABIP, 33.0 HR/FB, 183.0 Luck Score
Kolby Allard - 43.0 RISP H%, 0.5 BABIP, 25.0 HR/FB, 183.0 Luck Score
George Klassen - 38.0 RISP H%, 0.467 BABIP, 33.0 HR/FB, 181.0 Luck Score
Michael Lorenzen - 36.0 RISP H%, 0.415 BABIP, 30.0 HR/FB, 174.0 Luck Score
Tanner Bibee - 31.0 RISP H%, 0.441 BABIP, 33.0 HR/FB, 173.0 Luck Score
Ryan Weiss - 33.0 RISP H%, 0.429 BABIP, 30.0 HR/FB, 172.0 Luck Score
AJ Blubaugh - 42.0 RISP H%, 0.357 BABIP, 25.0 HR/FB, 169.0 Luck Score
Anthony Banda - 46.0 RISP H%, 0.417 BABIP, 20.0 HR/FB, 169.0 Luck Score
David Peterson - 40.0 RISP H%, 0.432 BABIP, 20.0 HR/FB, 167.0 Luck Score
Kodai Senga - 31.0 RISP H%, 0.478 BABIP, 22.0 HR/FB, 165.0 Luck Score
Jesse Scholtens - 0.0 RISP H%, 0.2 BABIP, 0.0 HR/FB, 23.0 Luck Score
Osvaldo Bido - 0.0 RISP H%, 0.222 BABIP, 0.0 HR/FB, 28.0 Luck Score
Shota Imanaga - 0.0 RISP H%, 0.156 BABIP, 7.0 HR/FB, 29.0 Luck Score
Tyler Phillips - 0.0 RISP H%, 0.227 BABIP, 0.0 HR/FB, 30.0 Luck Score
Jose Soriano - 0.0 RISP H%, 0.143 BABIP, 10.0 HR/FB, 31.0 Luck Score
Michael Wacha - 0.0 RISP H%, 0.158 BABIP, 8.0 HR/FB, 32.0 Luck Score
Jeffrey Springs - 17.0 RISP H%, 0.13 BABIP, 0.0 HR/FB, 34.0 Luck Score
Chad Patrick - 10.0 RISP H%, 0.222 BABIP, 0.0 HR/FB, 35.0 Luck Score
Nolan McLean - 17.0 RISP H%, 0.146 BABIP, 0.0 HR/FB, 35.0 Luck Score
Martin Perez - 14.0 RISP H%, 0.194 BABIP, 0.0 HR/FB, 36.0 Luck Score
Jose Soriano - 73 TBF, 34.8% CSW%
Jesus Luzardo - 98 TBF, 33.8% CSW%
Michael Wacha - 74 TBF, 33.7% CSW%
Nolan McLean - 89 TBF, 33.6% CSW%
Logan Gilbert - 70 TBF, 33.3% CSW%
Cam Schlittler - 81 TBF, 33.2% CSW%
Dylan Cease - 89 TBF, 33.0% CSW%
Tyler Glasnow - 71 TBF, 33.0% CSW%
Cristopher Sanchez - 74 TBF, 32.3% CSW%
Aaron Nola - 93 TBF, 32.2% CSW%
Shota Imanaga - 82 TBF, 37.8% K%
Cam Schlittler - 81 TBF, 37.0% K%
Dylan Cease - 89 TBF, 36.0% K%
MacKenzie Gore - 85 TBF, 35.3% K%
Kevin Gausman - 88 TBF, 35.2% K%
Jose Soriano - 73 TBF, 32.9% K%
Gavin Williams - 89 TBF, 32.6% K%
Nolan McLean - 89 TBF, 31.5% K%
Taj Bradley - 93 TBF, 31.2% K%
Ryan Weathers - 90 TBF, 31.1% K%
Cam Schlittler - 81 TBF, 35.8% K-BB%
Shota Imanaga - 82 TBF, 31.7% K-BB%
Kevin Gausman - 88 TBF, 29.5% K-BB%
Jose Soriano - 73 TBF, 26.0% K-BB%
Jesus Luzardo - 98 TBF, 25.5% K-BB%
Tyler Glasnow - 71 TBF, 25.4% K-BB%
Emerson Hancock - 85 TBF, 24.7% K-BB%
Ryan Weathers - 90 TBF, 23.3% K-BB%
Taj Bradley - 93 TBF, 22.6% K-BB%
Nolan McLean - 89 TBF, 22.5% K-BB%
Logan Webb - 79 TBF, 62.5% GB%
George Kirby - 103 TBF, 59.5% GB%
Brayan Bello - 72 TBF, 59.3% GB%
Jose Soriano - 73 TBF, 59.1% GB%
Cristopher Sanchez - 74 TBF, 58.7% GB%
David Peterson - 97 TBF, 58.5% GB%
Clay Holmes - 93 TBF, 58.2% GB%
Framber Valdez - 104 TBF, 57.8% GB%
Jack Kochanowicz - 99 TBF, 57.6% GB%
Will Warren - 80 TBF, 56.6% GB%
Braxton Ashcraft - 91 TBF, 29.7 K%, 7.7 BB%, 53.6% GB%
Cam Schlittler - 81 TBF, 37.0 K%, 1.2 BB%, 50.0% GB%
Chase Dollander - 80 TBF, 28.8 K%, 7.5 BB%, 56.0% GB%
Jesus Luzardo - 98 TBF, 30.6 K%, 5.1 BB%, 52.4% GB%
Jose Soriano - 73 TBF, 32.9 K%, 6.8 BB%, 59.1% GB%
Kevin Gausman - 88 TBF, 35.2 K%, 5.7 BB%, 46.2% GB%
Nick Pivetta - 47 TBF, 42.6 K%, 6.4 BB%, 45.8% GB%
Paul Skenes - 63 TBF, 27.0 K%, 7.9 BB%, 52.5% GB%
Brandon Nimmo (TEX) 6 PA, 9 Swings, 2 Barrels, 0 HR
Dillon Dingler (DET) 5 PA, 8 Swings, 3 Barrels, 1 HR
Hunter Goodman (COL) 4 PA, 9 Swings, 2 Barrels, 1 HR
Marcell Ozuna (PIT) 5 PA, 8 Swings, 2 Barrels, 1 HR
Miguel Vargas (CWS) 5 PA, 9 Swings, 2 Barrels, 1 HR
Nick Kurtz (OAK) 5 PA, 7 Swings, 2 Barrels, 0 HR
Vinnie Pasquantino (KC) 5 PA, 11 Swings, 2 Barrels, 1 HR
Jacob Young, Yesterday: 107.8 Previous High: 107.0
Oneil Cruz (PIT) - 119.0mph - double
Vladimir Guerrero Jr. (TOR) - 114.6mph - single
Mike Trout (LAA) - 114.6mph - home_run
Tyler Soderstrom (OAK) - 112.9mph - double
Hunter Goodman (COL) - 111.7mph - double
Lawrence Butler (OAK) - 111.6mph - field_out
Munetaka Murakami (CWS) - 111.2mph - field_out
Giancarlo Stanton (NYY) - 111.1mph - home_run
Jac Caglianone (KC) - 110.7mph - single
Riley Greene (DET) - 109.8mph - double
Top 10
Josh Naylor - 78 PA, 0.186 wOBA, 0.294 xwOBA, 0.108 Diff
Bryson Stott - 55 PA, 0.215 wOBA, 0.321 xwOBA, 0.106 Diff
Alec Bohm - 65 PA, 0.171 wOBA, 0.267 xwOBA, 0.096 Diff
Michael Harris II - 65 PA, 0.265 wOBA, 0.358 xwOBA, 0.093 Diff
Fernando Tatis Jr. - 78 PA, 0.306 wOBA, 0.389 xwOBA, 0.083 Diff
Jake Cronenworth - 65 PA, 0.232 wOBA, 0.315 xwOBA, 0.083 Diff
Marcell Ozuna - 57 PA, 0.209 wOBA, 0.291 xwOBA, 0.082 Diff
Dillon Dingler - 57 PA, 0.385 wOBA, 0.465 xwOBA, 0.08 Diff
Alek Thomas - 55 PA, 0.189 wOBA, 0.268 xwOBA, 0.079 Diff
Victor Caratini - 63 PA, 0.33 wOBA, 0.408 xwOBA, 0.078 Diff
Bottom 10
Andy Pages - 67 PA, 0.476 wOBA, 0.375 xwOBA, -0.101 Diff
Brooks Lee - 54 PA, 0.325 wOBA, 0.239 xwOBA, -0.086 Diff
C.J. Abrams - 72 PA, 0.52 wOBA, 0.439 xwOBA, -0.081 Diff
Brendan Donovan - 65 PA, 0.41 wOBA, 0.338 xwOBA, -0.072 Diff
Connor Norby - 66 PA, 0.379 wOBA, 0.311 xwOBA, -0.068 Diff
Hunter Goodman - 73 PA, 0.365 wOBA, 0.301 xwOBA, -0.064 Diff
Shea Langeliers - 78 PA, 0.429 wOBA, 0.367 xwOBA, -0.062 Diff
Andres Gimenez - 70 PA, 0.357 wOBA, 0.296 xwOBA, -0.061 Diff
Teoscar Hernandez - 59 PA, 0.409 wOBA, 0.348 xwOBA, -0.061 Diff
Nico Hoerner - 79 PA, 0.424 wOBA, 0.364 xwOBA, -0.06 Diff
C.J. Abrams: 35.0 PA, +0.202 xwOBA OE
Mike Trout: 42.0 PA, +0.201 xwOBA OE
Bryce Harper: 32.0 PA, +0.179 xwOBA OE
Aaron Judge: 42.0 PA, +0.154 xwOBA OE
Dillon Dingler: 32.0 PA, +0.145 xwOBA OE
Jorge Soler: 31.0 PA, +0.145 xwOBA OE
James Wood: 42.0 PA, +0.14 xwOBA OE
Yordan Alvarez: 38.0 PA, +0.13 xwOBA OE
Kevin McGonigle: 37.0 PA, +0.123 xwOBA OE
Jose Ramirez: 41.0 PA, +0.119 xwOBA OE
Ceddanne Rafaela: 27.0 PA, +0.118 xwOBA OE
Jordan Walker: 36.0 PA, +0.113 xwOBA OE
Brice Turang: 27.0 PA, +0.109 xwOBA OE
Xander Bogaerts: 35.0 PA, +0.107 xwOBA OE
Francisco Alvarez: 30.0 PA, +0.107 xwOBA OE
Graham Pauley: 29.0 PA, -0.242 xwOBA OE
Jazz Chisholm: 36.0 PA, -0.145 xwOBA OE
Brady House: 35.0 PA, -0.14 xwOBA OE
Denzel Clarke: 29.0 PA, -0.134 xwOBA OE
Brett Baty: 28.0 PA, -0.126 xwOBA OE
Michael Busch: 29.0 PA, -0.119 xwOBA OE
Kazuma Okamoto: 29.0 PA, -0.118 xwOBA OE
Salvador Perez: 36.0 PA, -0.109 xwOBA OE
Chandler Simpson: 34.0 PA, -0.1 xwOBA OE
Alek Thomas: 28.0 PA, -0.1 xwOBA OE
Jose Altuve: 34.0 PA, -0.099 xwOBA OE
Cody Bellinger: 38.0 PA, -0.097 xwOBA OE
Ozzie Albies: 34.0 PA, -0.091 xwOBA OE
Sal Frelick: 30.0 PA, -0.09 xwOBA OE
Jorge Barrosa: 36.0 PA, -0.083 xwOBA OE
Aaron Judge - 77 PA, 48 BIP, 14 Brls, 29.2 Brl%
Mike Trout - 82 PA, 50 BIP, 14 Brls, 28.0 Brl%
Kyle Schwarber - 75 PA, 31 BIP, 8 Brls, 25.8 Brl%
James Wood - 87 PA, 47 BIP, 12 Brls, 25.5 Brl%
Jordan Walker - 71 PA, 44 BIP, 11 Brls, 25.0 Brl%
Sal Stewart - 76 PA, 48 BIP, 11 Brls, 22.9 Brl%
Ben Rice - 64 PA, 35 BIP, 8 Brls, 22.9 Brl%
Matt Olson - 83 PA, 51 BIP, 11 Brls, 21.6 Brl%
Owen Caissie - 57 PA, 28 BIP, 6 Brls, 21.4 Brl%
Yordan Alvarez - 81 PA, 56 BIP, 12 Brls, 21.4 Brl%
Yordan Alvarez - 81 PA, 0.562 xwOBA
Mike Trout - 82 PA, 0.477 xwOBA
Dillon Dingler - 57 PA, 0.465 xwOBA
Aaron Judge - 77 PA, 0.46 xwOBA
Ben Rice - 64 PA, 0.457 xwOBA
Bryce Harper - 72 PA, 0.446 xwOBA
Jordan Walker - 71 PA, 0.444 xwOBA
C.J. Abrams - 72 PA, 0.439 xwOBA
Luke Raley - 62 PA, 0.435 xwOBA
Francisco Alvarez - 54 PA, 0.431 xwOBA
Steven Kwan - 79 PA, 107 Swings, 94.4 Cont%
Liam Hicks - 62 PA, 92 Swings, 93.5 Cont%
Geraldo Perdomo - 73 PA, 120 Swings, 91.7 Cont%
Luis Arraez - 71 PA, 135 Swings, 90.4 Cont%
Nico Hoerner - 79 PA, 126 Swings, 89.7 Cont%
Chandler Simpson - 72 PA, 115 Swings, 89.6 Cont%
Kevin McGonigle - 76 PA, 123 Swings, 87.8 Cont%
Luke Keaschall - 75 PA, 122 Swings, 86.9 Cont%
Jakob Marsee - 86 PA, 141 Swings, 86.5 Cont%
Jorbit Vivas - 48 PA, 88 Swings, 86.4 Cont%
Oneil Cruz - 8 Attempts (8 steals)
Jakob Marsee - 8 Attempts (7 steals)
Jose Ramirez - 6 Attempts (6 steals)
Geraldo Perdomo - 6 Attempts (5 steals)
Brenton Doyle - 5 Attempts (4 steals)
Chandler Simpson - 5 Attempts (3 steals)
Jose Caballero - 5 Attempts (5 steals)
James Wood - 4 Attempts (4 steals)
Edouard Julien - 4 Attempts (2 steals)
C.J. Abrams - 4 Attempts (2 steals)
Elly De La Cruz - 4 Attempts (4 steals)
Bobby Witt Jr. - 4 Attempts (3 steals)
Jazz Chisholm Jr. - 4 Attempts (4 steals)
Oneil Cruz - 10 Attempts (9 steals)
Geraldo Perdomo - 9 Attempts (6 steals)
Chandler Simpson - 9 Attempts (7 steals)
Jakob Marsee - 9 Attempts (8 steals)
Jazz Chisholm Jr. - 9 Attempts (8 steals)
Bobby Witt Jr. - 9 Attempts (8 steals)
Brice Turang - 8 Attempts (6 steals)
Nasim Nunez - 8 Attempts (7 steals)
Jose Ramirez - 8 Attempts (8 steals)
Jose Caballero - 8 Attempts (8 steals)
Brenton Doyle - 7 Attempts (5 steals)
Pete Crow-Armstrong - 6 Attempts (4 steals)
C.J. Abrams - 6 Attempts (4 steals)
Derek Hill - 6 Attempts (3 steals)
Elly De La Cruz - 6 Attempts (5 steals)
Ronald Acuna Jr. - 6 Attempts (4 steals)
Nico Hoerner - 6 Attempts (6 steals)
Jake McCarthy - 6 Attempts (5 steals)
Bryce Harper - 72 PA, 12.5 K%, 17.0 Brl%
Dillon Dingler - 57 PA, 15.8 K%, 20.5 Brl%
Drake Baldwin - 86 PA, 17.4 K%, 15.9 Brl%
Freddie Freeman - 75 PA, 13.3 K%, 15.0 Brl%
Ronald Acuna Jr. - 85 PA, 20.0 K%, 15.8 Brl%
Vladimir Guerrero Jr. - 76 PA, 11.8 K%, 14.3 Brl%
Yordan Alvarez - 81 PA, 11.1 K%, 21.4 Brl%
Oswald Peraza: +3.88
Luis Robert: +3.15
Konnor Griffin: +3.03
Xander Bogaerts: +2.95
Dylan Beavers: +2.88
Jac Caglianone: -2.7
Nick Castellanos: -2.65
Denzel Clarke: -2.55
Ketel Marte: -2.25
Trea Turner: -2.2
Jose Barrero (BAL): 3/4, 3R, 2HR, 4RBI, 0SB, 44FPts
Pedro Ramirez (CHC): 4/6, 2R, 1HR, 5RBI, 2SB, 43FPts
Marcus Lee Sang (TEX): 3/4, 3R, 2HR, 5RBI, 0SB, 41FPts
Alex Binelas (PHI): 3/4, 2R, 2HR, 4RBI, 0SB, 39FPts
Ben McLaughlin (ARI): 3/5, 2R, 2HR, 5RBI, 0SB, 39FPts
Kervin Pichardo (WSH): 2/3, 2R, 1HR, 3RBI, 2SB, 37FPts
Manuel Pena (ARI): 5/5, 2R, 1HR, 2RBI, 0SB, 36FPts
J.T. Arruda (SEA): 1/4, 3R, 1HR, 4RBI, 2SB, 36FPts
Mason McCoy (SD): 2/3, 2R, 2HR, 4RBI, 0SB, 34FPts
Nick Raposo (SEA): 4/5, 3R, 1HR, 2RBI, 0SB, 31FPts
Eduardo Rivera (BOS): 0 Pitches, 5IP, 3H, 0ER, 9K, 2BB, 31FPts
Carlos Carrasco (ATL): 0 Pitches, 6IP, 4H, 0ER, 8K, 0BB, 27FPts
Josh Hartle (CLE): 0 Pitches, 5IP, 2H, 0ER, 7K, 3BB, 27FPts
Connor Prielipp (MIN): 0 Pitches, 5IP, 4H, 1ER, 8K, 1BB, 26FPts
Nestor German (BAL): 0 Pitches, 4IP, 3H, 1ER, 10K, 1BB, 25FPts
Garrett Baumann (None): 0 Pitches, 5IP, 4H, 1ER, 7K, 3BB, 23FPts
Miguel Mendez (SD): 0 Pitches, 5IP, 2H, 1ER, 6K, 2BB, 22FPts
Thomas White (MIA): 0 Pitches, 4IP, 2H, 1ER, 8K, 0BB, 21FPts
Ryan Hawks (SEA): 0 Pitches, 6IP, 2H, 0ER, 2K, 2BB, 19FPts
Dane Dunning (SEA): 0 Pitches, 6IP, 1H, 1ER, 2K, 2BB, 17FPts
Ben Ross (AA - MIN) 54 PA 1.367 OPS
Vimael Machin (AAA - COL) 52 PA 1.205 OPS
Cayden Wallace (AA - WSH) 55 PA 1.19 OPS
James Tibbs III (AAA - LAD) 85 PA 1.176 OPS
Carson Roccaforte (AA - KC) 58 PA 1.152 OPS
Luis Lara (AAA - MIL) 68 PA 1.103 OPS
JJ Bleday (AAA - CIN) 76 PA 1.093 OPS
Tsung-Che Cheng (AAA - BOS) 53 PA 1.093 OPS
Blaze Jordan (AAA - STL) 58 PA 1.07 OPS
Alika Williams (AAA - PIT) 58 PA 1.062 OPS
Braden Montgomery (AA - CWS) 57 PA 1.057 OPS
Angel Genao (AA - CLE) 52 PA 1.045 OPS
Stuart Fairchild (AAA - CLE) 72 PA 1.044 OPS
Vinny Capra (AAA - BOS) 55 PA 1.041 OPS
Michael Chavis (AAA - CIN) 61 PA 1.035 OPS
Jim Jarvis (AAA - ATL) 82 PA 1.033 OPS
Colby Thomas (AAA - OAK) 60 PA 1.027 OPS
Pedro Ramirez (AAA - CHC) 73 PA 1.026 OPS
Charlie Condon (AAA - COL) 62 PA 1.023 OPS
Ryan Ward (AAA - LAD) 81 PA 1.02 OPS
Jake Brooks (AA - COL) 14 IP 38.6% K-BB
Mike Paredes (AA - MIN) 14 IP 33.9% K-BB
Bruce Zimmermann (AAA - STL) 20 IP 28.0% K-BB
Adam Seminaris (AA - PHI) 14 IP 27.8% K-BB
Payton Tolle (AAA - BOS) 15 IP 24.5% K-BB
Brendan Beck (AAA - NYY) 20 IP 24.4% K-BB
Luke Fox (AA - LAD) 15 IP 24.2% K-BB
Chase Petty (AAA - CIN) 16 IP 23.7% K-BB
Zack Wheeler (AA - PHI) 16 IP 23.5% K-BB
Didier Fuentes (AAA - ATL) 16 IP 22.2% K-BB
Connor Prielipp (AAA - MIN) 15 IP 22.2% K-BB
Gabriel Hughes (AAA - COL) 17 IP 21.8% K-BB
Andrew Alvarez (AAA - WSH) 19 IP 21.0% K-BB
Braxton Garrett (AAA - MIA) 15 IP 21.0% K-BB
Logan Workman (AAA - TB) 19 IP 20.5% K-BB
Coleman Crow (AAA - MIL) 15 IP 19.7% K-BB
Ryan Hawks (AA - SEA) 15 IP 19.7% K-BB
Josh Stephan (AAA - TEX) 15 IP 19.7% K-BB
Levi Wells (AAA - BAL) 14 IP 19.3% K-BB
Jonah Tong (AAA - NYM) 15 IP 19.1% K-BB
Matt Waldron (1.0% Owned): Projected 5.14IP 2.26ER 5.33SO 1.48BB 14.94FPts
Aaron Civale (16.0% Owned): Projected 5.64IP 2.39ER 4.73SO 1.88BB 14.53FPts
Chris Bassitt (28.0% Owned): Projected 6.11IP 2.61ER 4.68SO 2.47BB 14.1FPts
C.J. Abrams - 36 PA, 1.398 OPS
Jorge Soler - 31 PA, 1.227 OPS
Hunter Goodman - 31 PA, 1.219 OPS
Jeremiah Jackson - 33 PA, 1.206 OPS
Connor Norby - 33 PA, 1.169 OPS
Jordan Walker - 36 PA, 1.155 OPS
Austin Martin - 28 PA, 1.155 OPS
Sal Stewart - 38 PA, 1.15 OPS
Mike Trout - 43 PA, 1.145 OPS
Luke Raley - 34 PA, 1.127 OPS
Austin Martin SS (2.0% Owned): Projected 0.73R 0.08HR 0.64RBI 0.77SO 0.45BB 0.17SB 8.99FPts
Trent Grisham CF (48.0% Owned): Projected 0.82R 0.19HR 0.56RBI 1.1SO 0.62BB 0.06SB 8.79FPts
Sam Antonacci SS (21.0% Owned): Projected 0.64R 0.11HR 0.67RBI 0.72SO 0.5BB 0.22SB 8.69FPts
Jesus Sanchez CF (17.0% Owned): Projected 0.57R 0.14HR 0.65RBI 0.98SO 0.41BB 0.1SB 8.1FPts
Masataka Yoshida OF (3.0% Owned): Projected 0.58R 0.11HR 0.58RBI 0.54SO 0.21BB 0.08SB 8.02FPts
Andrew Benintendi LF (20.0% Owned): Projected 0.66R 0.14HR 0.49RBI 0.79SO 0.38BB 0.03SB 8.0FPts
Brice Matthews SS (4.0% Owned): Projected 0.6R 0.16HR 0.55RBI 1.0SO 0.35BB 0.2SB 7.97FPts
Nathan Lukes OF (4.0% Owned): Projected 0.66R 0.1HR 0.45RBI 0.63SO 0.49BB 0.06SB 7.92FPts
Brett Baty 3B (29.0% Owned): Projected 0.57R 0.16HR 0.59RBI 1.25SO 0.43BB 0.09SB 7.91FPts
Josh Bell 1B (35.0% Owned): Projected 0.58R 0.17HR 0.62RBI 0.72SO 0.45BB 0.01SB 7.82FPts


How do I get to the tableau pages ? There’s not links at the end of articles anymore