People were really digging the slate preview I wrote yesterday. I went game-by-game and showed some screenshots from the new slate analysis app. And I have to say, they are right. It was a cool way of doing it. I read it back to myself last night and felt pretty good about it.
However, there are only so many hours in the day. As much as I might like to, it’s pretty rare I can find the time to do that for 10-15 games. But I will see what I can do. Maybe I can just pick a handful of games per day to highlight. I could use it as a means to talk about players generally as well, so it stays relevant for the people who are here and not doing the daily games.
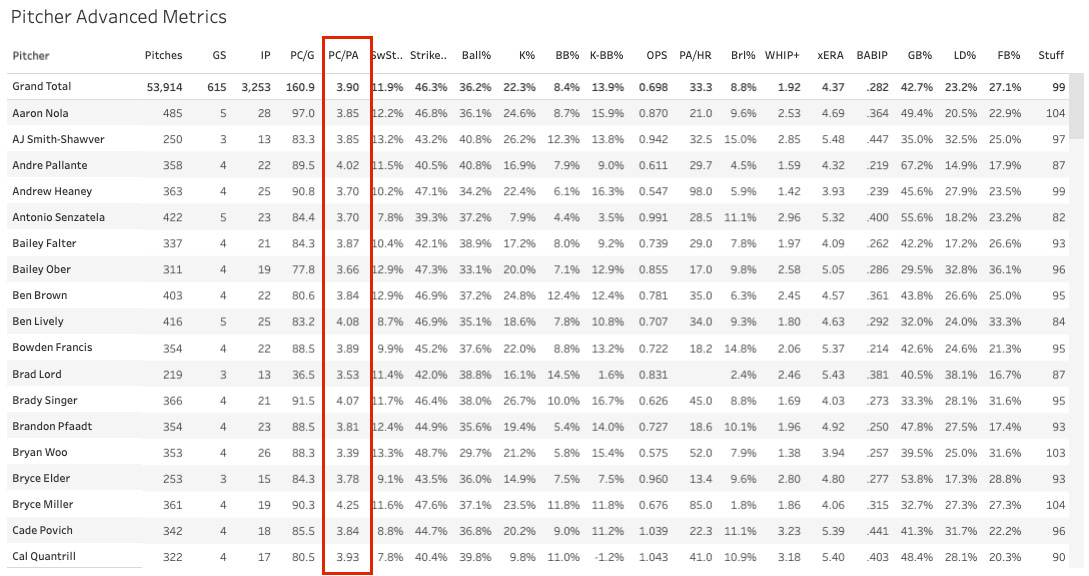
Somebody asked me to add “pitches per plate appearances” to the pitching dashboard. Ask, and you should receive! Here it is:
Your top five:
Jose Soriano 3.38
Bryan Woo 3.39
Justin Steele (RIP) 3.40
Shane Smith 3.42
Kyle Freeland 3.43
Your bottom five:
Will Warren 4.72
Logan Gilbert 4.35
Hunter Brown 4.35
Grant Holmes 4.31
Yoshinobu Yamamoto 4.31
Those are pretty interesting names. Gilbert and Yamamoto throw a lot of strikes, so you wouldn’t expect them to be throwing a ton of pitches to each batter.
There are a couple of different ways to get to a high PC/PA. You could have trouble throwing strikes and just be giving hitters a few easy takes per plate appearance. You could be so nasty that nobody can hit your stuff, so it takes you at least three pitches for anything to be done in a given PA. Or maybe you’re just so confident in your ability to throw strikes in two or three ball counts that you’re willing to go after chases.
I really would have expected this to be highly correlated with ball rate. It is a bit, but it’s not a super strong relationship.
I feel like we have different explanations for the guys with the lowest rates. Jose Soriano doesn’t get many whiffs and he throws a lot of sinkers, which are enticing to swing at. So hitters go after it early because they know they can get the bat on it. That works out pretty well for him because of his now 63% GB%. He’ll face the Pirates tonight and will probably go eight innings.
Bryan Woo is second. This guy fills up the strike zone with fastballs. He’s very confident in his ability to generate soft contact with how unique and nasty his heaters are, and that works very well for him (an elite 1.38 WHIP+ so far, in the top 15 in the league).
And then you have Kyle Freeland at fifth. I feel like he’s out there just like “get me off of this hill, I want to go home”.
Let’s get out the spotlight and hit three SPs and three hitters. Maybe this is how I should do the daily notes every day just to have some consistency.
I also wrestle with emoji usage. They do make the page look a bit better, and they can even give you more information when used correctly. But I can’t shake the feeling that it’s childish or feminine to use them. I’ll keep shaking.
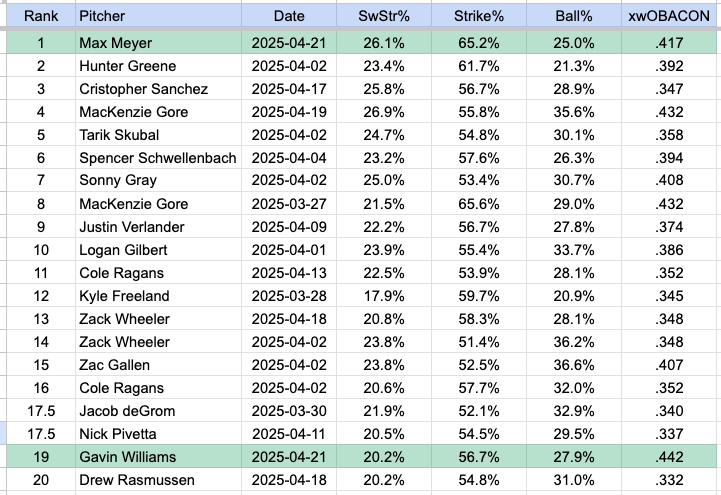
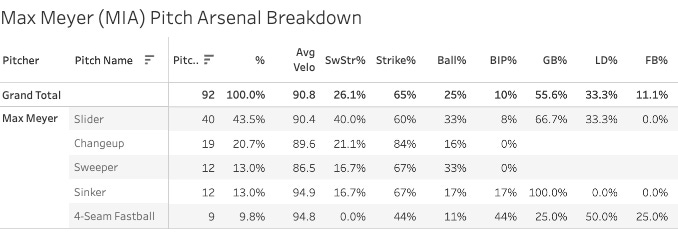
6 IP, 5 H, 0 R, 14 K, 0 BB, 26.1% SwStr%, 65.2% Strike%,
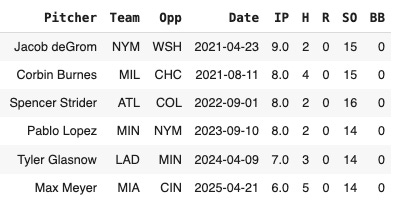
That’s one of the greatest lines you’ll ever see. Incredible stuff from Meyer. Since 2021 (the beginning of the new world, where all of my data begins), there have been only six starts with no runs, no walks, and at least 14 strikeouts.
It was the #1 start of the year on the SP Grades.
The crazy thing is that he threw only 21 fastballs the whole time.
He went hard to the slider, and you would have to say it was a good choice!
We talked about this a bit yesterday. How viable is “hide your fastball” strategy? We haven’t seen it done successfully very often in the past, but that doesn’t necessarily mean it can’t be done in the future. Maybe high fastball usage is one of those things that everybody does because that’s how it’s always been done. Or maybe there’s a better reason for it, I suspect there is. The fastball is clearly the easiest pitch to command, and if you can’t throw strikes, you can’t stay in the MLB. So that might be part of it. I also have to imagine that breaking balls are tougher on your arm. You would probably tire out quicker and be more at risk of injury if you’re throwing 75+ sliders/curveballs every outing. But who knows. I’m sure there are people out there who know this stuff a lot better than I do.
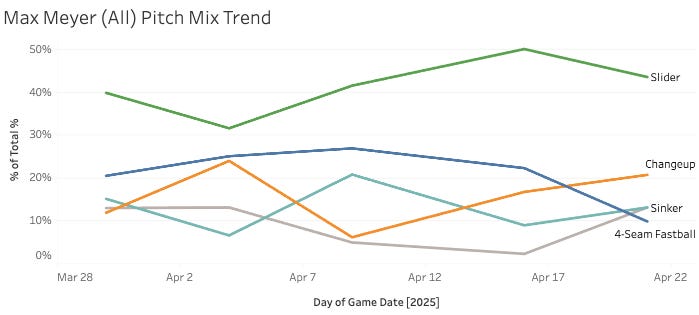
Meyer has led the way with the slider in every start, but this was the first time that the changeup was second.
He mostly said goodbye to the four-seamer last night. The slider and changeup are great for Meyer, so it makes a lot of sense to feature them. But how sustainable is that kind of non-fastball usage? I don’t know.
But one thing is certain - Meyer is a must-own starter. This wasn’t one elite start out of nowhere. He’s been strong all season.
33.9% K%, 5.8% BB%, 17.4% SwStr%, 33.9% Ball%, 57% GB%
I didn’t draft Max Meyer a single time. I was sad to see that last night, because I did think I had taken him once or twice. I liked the price just fine in draft season. I guess I didn’t do enough drafts… yeah that’s the lesson I should learn for next year.
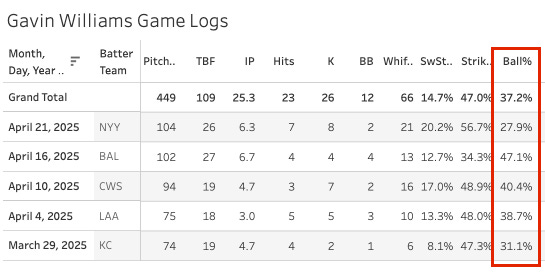
G-Willy sneaked into the top 20 starts of the year. You may have noticed that above!
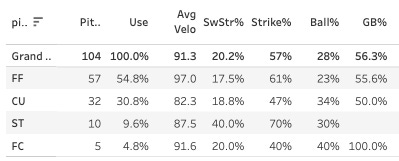
6.1 IP, 7 H, 2 ER, 8 K, 2 BB, 20.2% SwStr%, 27.9% Ball%
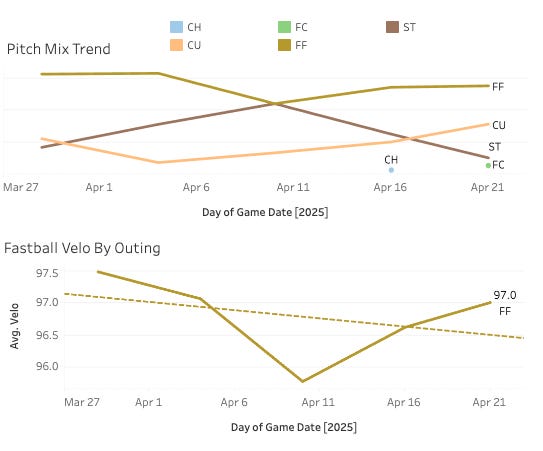
That is a ton of strikes! Good for him. He had a bit extra velo on the fastball this time and dominated with that pitch. The curveball and sweeper were also fantastic in their 41% usage.
He has featured the curveball a bit more lately.
I don’t really have a ton to analyze here. The difference last night was the strike-throwing. He posted a season low (by a mile) ball rate of 27.9%.
I don’t think you’ll see that again. He’s never been very good at earning strikes. This starts just shows you the upside that he has. And that’s good, because I’ve been telling people that he has upside every time I’ve talked about him. So it’s nice for him to back me up on that.
Is he a must-own in a ten-team league? I don’t think so. But he’s certainly a decent speculative add. I’d take him over someone who you know doesn’t have much of a ceiling in the fantasy game.
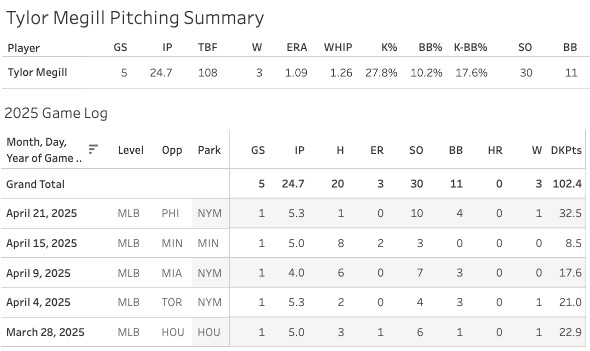
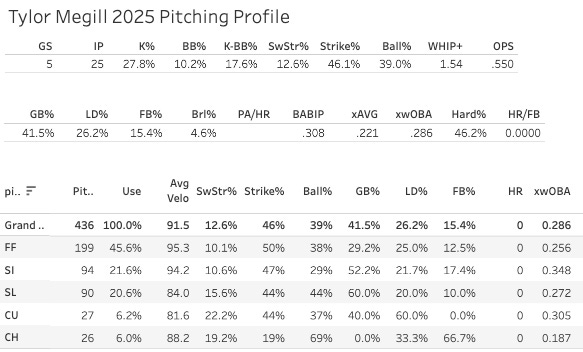
It’s gotta go to Megill for the third spotlight. TEN strikeouts!
5.1 IP, 1 H, 0 R, 10 K, 4 BB, 15.2% SwStr%, 42.4% Ball%
And all ten of those bad boys were on my bench! I was terrified, mortified, petrified, stupefied by this matchup with the Phillies.
I have seen like seven movies, and A Beautiful Mind is one of them.
And you know what, sometimes being smart is a real bitch. If I were old school, I would have looked at the 1.40 ERA and 50% win rate that Megill had coming into yesterday and locked him into the lineup. No questions asked. A 1.40 ERA!!! But instead I’m like ooOooOooOOHhhhHhhhH NOoNOoo mEgIlll haS a HiGh BAllLLL raAtTEe thIS yeAr anD HHas BEen reAlLY inCoNisStent anD THe WiND is BLoWiNg OuT aNd thE pHilLiEs haVe hIs nUmbEr i DoNt WanT mY RaTIos to GeT trAShed On A mOnDAY and sat him.
The season stats:
That start brought his strikeout rate up five points and got the K-BB% above 17%. But still, the SwStr% (12.6%) and Ball% (39%) are not good for the year. He hasn’t given up a single home run yet. He’s not allowing fly balls (15%), so I guess it’s not the luckiest thing in the world that he hasn’t given up a bomb yet, but also, a 15% FB% is not sustainable. He will give up homers, and he continues to put guys on for free (3+ walks in three of his five outings).
I would try to sell high on the guy. But a couple of minutes after I hit “publish” on this, I won’t be able to do that because my whole league will have read about my plans.
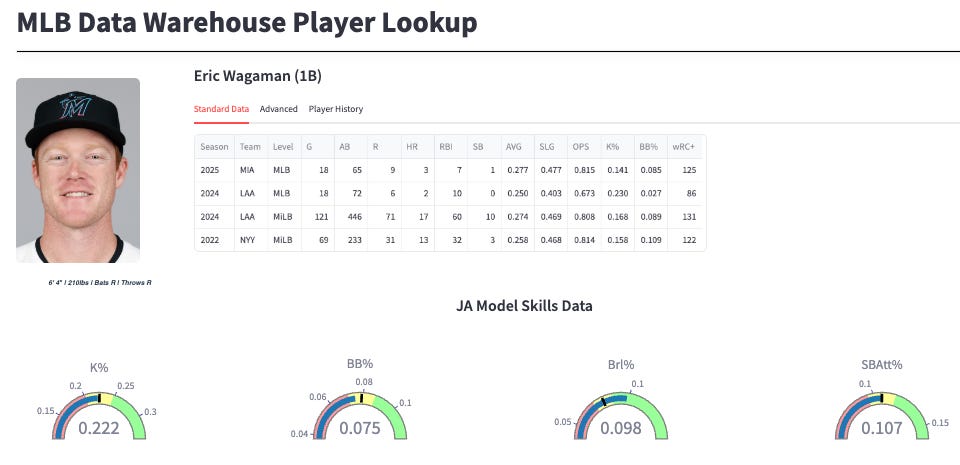
Yeah… who!? This is a Marlins player. I promise you, he is. Let’s pull up the unfinished MLB DW Player Lookup tool to see what he looks like.
The main reason I picked him is because my projection model has been recommending him almost daily for DFS purposes. I mean it really, really wants me to play Eric Wagaman every day. And I’ve done it plenty of times, but not yesterday.
But I mean, shout out to the model - it knew something that I didn’t. And that’s a real kick in the pants, isn’t it? Something I coded. I created it. I give it [artificial life]. And it’s telling me things I didn’t know. It’s kind of like when my four-year-old son tells me what kind of animal we’re looking at at the zoo. He’s real into that Wild Kratts show, so he knows a ton about animals. And I mostly hate animals, so he’s got the one-up on me in animal knowledge. I don’t even know if he’s right, I’ve just started taking his word for it.
I guess I just kind of compared one of my living, breathing, infinitely valuable children to some lines of code I wrote on a computer. But one thing I never do in the daily notes - hit “backspace”.
Here’s the story about Wagaman. So far this year:
Brl%: 9.1%
K%: 14.1%
BB%: 8.5%
Max EV: 109.7
90th EV: 106 (good)
xwOBA: .412
xBA: .329
Z-Cont%: 88% (high)
Swing%: 41% (very low)
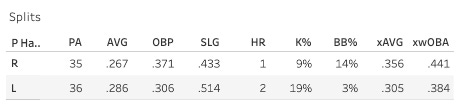
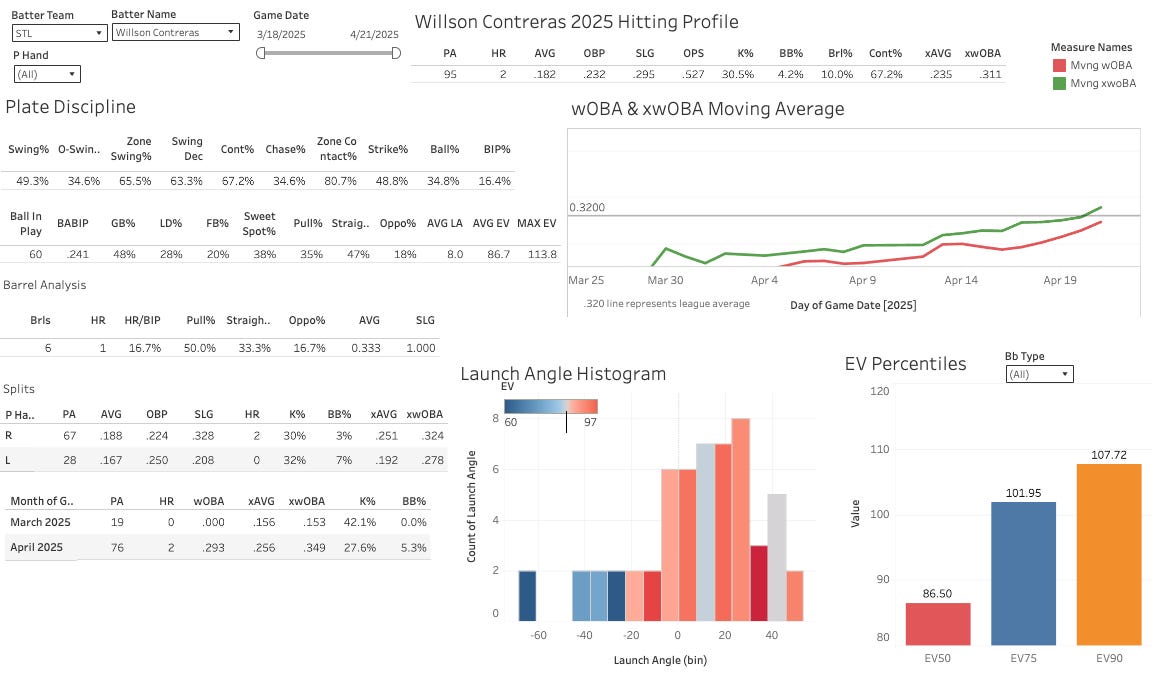
And he’s handled both righties and lefties well.
Let’s check the minor league career:
Wagaman is 27, so we’re not getting much prospect buzz out of him. And we probably shouldn’t be. But hey, a 17-10 season last year in the minors with a strong history of low K% and decent walk rates.
I don’t imagine this guy will ever end up as a recommended player for a 12-team league, but he can offer some decent production for those crazy deep leagues out there.
I just want to say that it’s getting better. He has 95 PAs this year, so let’s split it in half and do some comparing.
First 48 PA: .093/.167/.140, 44% K%, 4.2% BB%, .194 xwOBA, 0 HR
Last 47 PA: .267/.298/.444, 17% K%, 4.3% BB%, .428 xwOBA, 2 HR
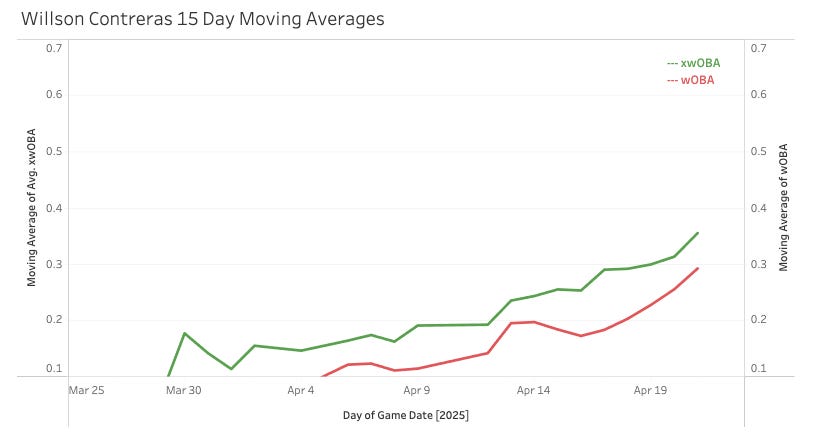
That wOBA/xwOBA moving average chart is funny. He was off the chart for awhile. I have to put bounds on the axes here to make these plots look decent. Decisions are made, but in Contreras’ case, I didn’t make the minimum low enough.
But things are looking UP right now. Keep the faith.
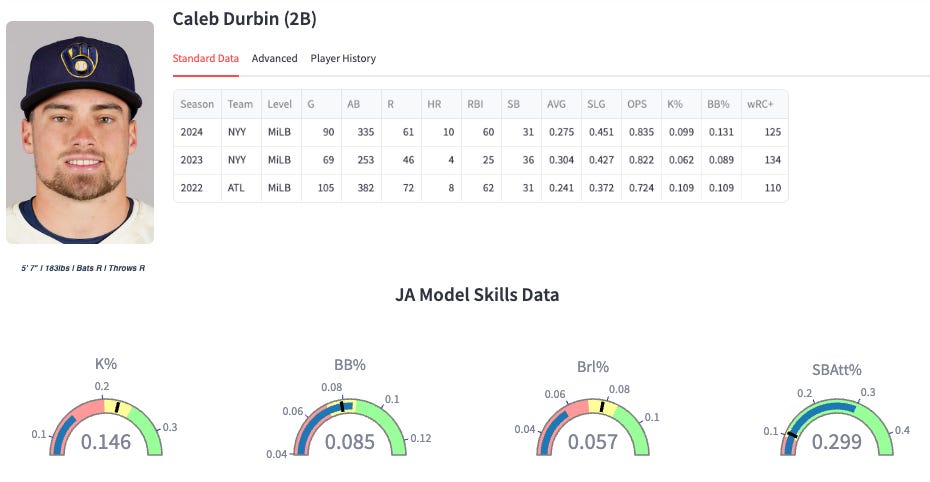
He has arrived, and he will play everyday for the Brewers, at least while he’s able to keep the job. They said he’s earned the job. That doesn’t mean he has it forever, but it does mean they’re unlikely to jerk him around back and forth to the bench and AAA or whatever. And he homered last night!
Let’s remind ourselves of the minor league resume first:
Not a lot of power, but plenty of steals and great AVG & OBP. His homer last night barely cracked 100mph.
I’m not trying to rain on the parade, but I do think it’s a bit foolish to think this will be a double-digit homer guy this year.
The reason to roster this guy would be for the steals and for hopes of a decent AVG/OBP. And those two things go together. You have to get on base to steal another base, so it will be key to watch the K% and BB% for him early on. We have just 16 PAs so far, and he’s neither struck out nor walked.
Like we talked about with Chandler Simpson in the waiver wire piece last weekend, I would never be counting on a high walk rate from a rookie that doesn’t have raw power. The last thing you want to do with a slow-swinging speedster would be to walk him. The chances of the guy going for extra bases are very low, but if you walk him, that’s as good as a double most of the time.
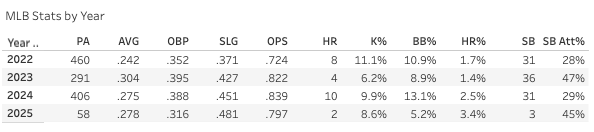
Durbin and Simpson will see a bunch of strikes, and it will be up to them to turn them into base hits.
That’s not a very good comparison, by the way. Simpson has a lot more speed than Durbin, and Durbin has more power than Simpson.
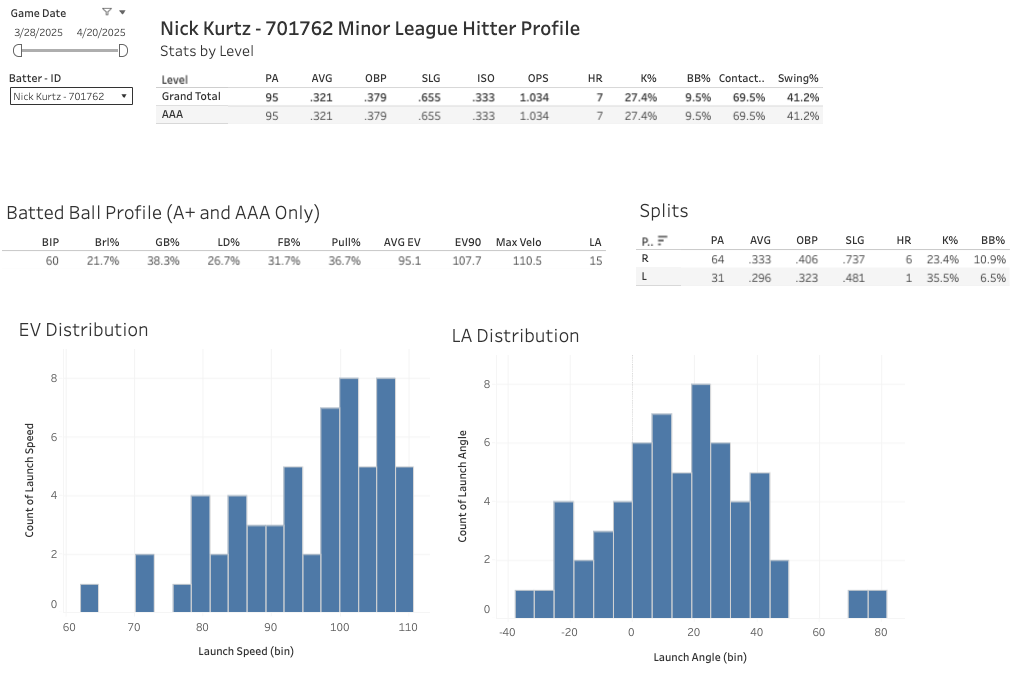
Alright, a bonus hitter spotty. It is Nick Kurtz day! I would imagine he’s owned in most league by now, but just in case, you should get him.
Somebody asked me yesterday if they should drop Christian Walker for him. And that’s a tough one. I think there’s a pretty good chance that Walker is the better hitter for the rest of this year. I mean we’ve seen Walker be awesome for three years now, and a slow start shouldn’t change our expectations too much. But I do get it. Kurtz has upside that Walker does not.
There’s just the chance that he strikes out at a very high clip for these first couple of months. My model has given him a 26% K% and a 10% BB%. Those are really strong marks for a rookie. If he does that, I think he’ll be awesome. But the risk is that the K% is more like 30% early on, and that would hold the production back. Here’s the 2025 minor league profile on him from the @JonPGH MiLB Statcast dashboard:
You do see a 27% K% in those 95 PAs. That’s pretty alarming. The contact rate is also under 70%. And the K% against lefties is at 35.5% while the slugging was down at .481.
The good news is… well, everything else. The power is legit (107.7 EV90), and he gets the ball into the air (38% GB%). I have little doubt that there will be homers, but you absolutely could be looking at a .220 or so batting average with it and some pretty rough cold streaks as he adjusts.
But it will be fun to watch him. The Athletics are a fun team, man.
I showed my wife the slate analysis app this morning, and she was like, “Where can I see the team’s records?”. And for a second in my head I was like “why would I put the team records there, who cares about that. But then I realized, she had a point! For the normal person, the team records are something you look for. I’m still not going to add them, but I do accept her argument.
That’ll do it, talk to you later!
1. Max Meyer
2. Gavin Williams
3. Tylor Megill
4. Clarke Schmidt
5. Hunter Brown
6. Kevin Gausman
7. Nick Lodolo
8. Walker Buehler
9. Robbie Ray
10. Spencer Schwellenbach
11. Keider Montero
12. Aaron Nola
13. Randy Vasquez
14. Quinn Priester
15. Erick Fedde
16. Jonathan Cannon
1. Max Meyer (vs. CIN): 42.5 Points
2. Hunter Brown (vs. TOR): 35.95 Points
3. Tylor Megill (vs. PHI): 32.99 Points
4. Walker Buehler (vs. CWS): 31.55 Points
5. Gavin Williams (vs. NYY): 24.84 Points
6. Spencer Schwellenbach (vs. STL): 16.95 Points
7. Hayden Birdsong (vs. MIL): 16.95 Points
8. Aaron Nola (vs. NYM): 12.84 Points
9. Kevin Gausman (vs. HOU): 12.1 Points
10. Brenan Hanifee (vs. SD): 11.9 Points
1. Max Meyer (MIA): 24 Whiffs (92 Pitches)
2. Gavin Williams (CLE): 21 Whiffs (104 Pitches)
3. Kevin Gausman (TOR): 14 Whiffs (96 Pitches)
4. Tylor Megill (NYM): 14 Whiffs (92 Pitches)
5. Clarke Schmidt (NYY): 13 Whiffs (80 Pitches)
6. Robbie Ray (SF): 12 Whiffs (92 Pitches)
7. Hunter Brown (HOU): 12 Whiffs (96 Pitches)
8. Aaron Nola (PHI): 11 Whiffs (101 Pitches)
9. Nick Lodolo (CIN): 11 Whiffs (99 Pitches)
10. Walker Buehler (BOS): 11 Whiffs (100 Pitches)
1. Max Meyer (MIA): 65.2 Strike%, 25.0 Ball%
2. Gavin Williams (CLE): 56.7 Strike%, 27.9 Ball%
3. Clarke Schmidt (NYY): 53.8 Strike%, 31.2 Ball%
4. Nick Lodolo (CIN): 52.5 Strike%, 28.3 Ball%
5. Hunter Brown (HOU): 51.0 Strike%, 35.4 Ball%
6. Tylor Megill (NYM): 50.0 Strike%, 42.4 Ball%
7. Walker Buehler (BOS): 48.0 Strike%, 37.0 Ball%
8. Kevin Gausman (TOR): 46.9 Strike%, 36.5 Ball%
9. Spencer Schwellenbach (ATL): 45.7 Strike%, 27.2 Ball%
10. Aaron Nola (PHI): 45.5 Strike%, 36.6 Ball%
11. Keider Montero (DET): 44.6 Strike%, 40.2 Ball%
12. Robbie Ray (SF): 43.5 Strike%, 40.2 Ball%
13. Erick Fedde (STL): 42.9 Strike%, 35.7 Ball%
14. Jonathan Cannon (CWS): 38.9 Strike%, 40.0 Ball%
15. Randy Vasquez (SD): 38.2 Strike%, 47.1 Ball%
1. Spencer Schwellenbach: 92 Pitches, 21 Outs, 4.38 POUT
2. Hunter Brown: 96 Pitches, 21 Outs, 4.57 POUT
3. Erick Fedde: 84 Pitches, 18 Outs, 4.67 POUT
4. Walker Buehler: 100 Pitches, 21 Outs, 4.76 POUT
5. Jonathan Cannon: 90 Pitches, 18 Outs, 5.0 POUT
6. Max Meyer: 92 Pitches, 18 Outs, 5.11 POUT
7. Aaron Nola: 101 Pitches, 19 Outs, 5.32 POUT
8. Kevin Gausman: 96 Pitches, 18 Outs, 5.33 POUT
9. Gavin Williams: 104 Pitches, 19 Outs, 5.47 POUT
10. Tylor Megill: 92 Pitches, 16 Outs, 5.75 POUT
Kevin Gausman's FF velo (43 pitches) UP 1.6mph to 95.6
Aaron Nola's SI velo (27 pitches) DOWN -1.5mph to 89.8
Walker Buehler's SI velo (14 pitches) DOWN -1.6mph to 92.9
Tylor Megill's SI velo (17 pitches) DOWN -1.6mph to 92.8
Aaron Nola's CH usage (22.8%) up 12.3 points
Clarke Schmidt's FC usage (52.5%) up 16.4 points
Keider Montero's SI usage (29.3%) up 19.8 points
Nick Lodolo's CU usage (38.4%) up 11.0 points
Quinn Priester's FC usage (25.9%) up 19.7 points
Randy Vasquez's FC usage (35.3%) up 18.7 points
Cristopher Sanchez - 79 TBF, 36.1% CSW%
Cole Ragans - 92 TBF, 36.0% CSW%
Logan Gilbert - 85 TBF, 34.1% CSW%
Max Meyer - 98 TBF, 34.0% CSW%
Zack Wheeler - 102 TBF, 34.0% CSW%
Tarik Skubal - 94 TBF, 33.4% CSW%
Hunter Greene - 99 TBF, 33.2% CSW%
Landen Roupp - 93 TBF, 33.2% CSW%
Ben Brown - 67 TBF, 33.1% CSW%
Kris Bubic - 78 TBF, 33.0% CSW%
Cole Ragans - 92 TBF, 42.4% K%
Logan Gilbert - 85 TBF, 38.8% K%
Chris Bassitt - 66 TBF, 36.4% K%
Yoshinobu Yamamoto - 67 TBF, 35.8% K%
Logan Webb - 94 TBF, 35.1% K%
Max Meyer - 98 TBF, 34.7% K%
Shane Baz - 89 TBF, 33.7% K%
Clay Holmes - 90 TBF, 33.3% K%
Zack Wheeler - 102 TBF, 32.4% K%
Eduardo Rodriguez - 75 TBF, 32.0% K%
Cole Ragans - 92 TBF, 37.0% K-BB%
Chris Bassitt - 66 TBF, 31.8% K-BB%
Logan Gilbert - 85 TBF, 31.8% K-BB%
Logan Webb - 94 TBF, 30.9% K-BB%
Yoshinobu Yamamoto - 67 TBF, 29.9% K-BB%
Max Meyer - 98 TBF, 28.6% K-BB%
Zack Wheeler - 102 TBF, 28.4% K-BB%
Eduardo Rodriguez - 75 TBF, 28.0% K-BB%
Cristopher Sanchez - 79 TBF, 25.3% K-BB%
Shane Baz - 89 TBF, 24.7% K-BB%
Andre Pallante - 68 TBF, 64.7% GB%
Dustin May - 65 TBF, 62.2% GB%
David Peterson - 69 TBF, 62.2% GB%
Yoshinobu Yamamoto - 67 TBF, 61.5% GB%
Max Meyer - 98 TBF, 59.6% GB%
Jose Soriano - 79 TBF, 58.9% GB%
Logan Webb - 94 TBF, 57.9% GB%
Antonio Senzatela - 93 TBF, 57.5% GB%
Jordan Hicks - 77 TBF, 56.6% GB%
Tanner Houck - 86 TBF, 55.7% GB%
Cristopher Sanchez - 79 TBF, 30.4 K%, 5.1 BB%, 55.1% GB%
Garrett Crochet - 102 TBF, 30.4 K%, 7.8 BB%, 44.4% GB%
Hunter Brown - 87 TBF, 27.6 K%, 3.4 BB%, 53.3% GB%
Kyle Leahy - 45 TBF, 31.1 K%, 4.4 BB%, 57.1% GB%
Logan Gilbert - 85 TBF, 38.8 K%, 7.1 BB%, 51.1% GB%
Logan Webb - 94 TBF, 35.1 K%, 4.3 BB%, 57.9% GB%
Luis L. Ortiz - 67 TBF, 31.3 K%, 7.5 BB%, 43.9% GB%
Max Meyer - 98 TBF, 34.7 K%, 6.1 BB%, 59.6% GB%
Yoshinobu Yamamoto - 67 TBF, 35.8 K%, 6.0 BB%, 61.5% GB%
Unluckiest
Marcus Stroman: 11.56 ERA, 5.73 SIERA
Charlie Morton: 10.89 ERA, 5.07 SIERA
Chase Dollander: 7.36 ERA, 3.35 SIERA
Cade Povich: 7.86 ERA, 4.25 SIERA
Easton Lucas: 7.41 ERA, 4.15 SIERA
Chris Sale: 6.17 ERA, 2.98 SIERA
German Marquez: 8.26 ERA, 5.07 SIERA
Tanner Houck: 7.66 ERA, 4.56 SIERA
Carmen Mlodzinski: 7.41 ERA, 4.38 SIERA
Aaron Nola: 6.43 ERA, 3.57 SIERA
Luckiest
Tyler Mahle: 0.67 ERA, 4.09 SIERA
Kodai Senga: 0.79 ERA, 3.86 SIERA
Randy Vasquez: 3.97 ERA, 6.84 SIERA
Mitchell Parker: 1.85 ERA, 4.62 SIERA
Tyler Anderson: 2.08 ERA, 4.82 SIERA
Quinn Priester: 1.93 ERA, 4.55 SIERA
Erick Fedde: 3.33 ERA, 5.94 SIERA
Tylor Megill: 1.09 ERA, 3.66 SIERA
Dustin May: 1.06 ERA, 3.6 SIERA
Osvaldo Bido: 2.61 ERA, 5.07 SIERA
Zack Wheeler - +5.0% CSW%, -1.8 BB%
Hunter Greene - +3.7% CSW%, -3.9 BB%
Jake Irvin - +3.8% CSW%, -2.6 BB%
Cole Ragans - +5.5% CSW%, -3.4 BB%
Kyle Freeland - +2.2% CSW%, -2.3 BB%
Matthew Liberatore - +4.4% CSW%, -4.4 BB%
Hayden Wesneski - +3.4% CSW%, -6.1 BB%
Luis L. Ortiz - +5.2% CSW%, -1.7 BB%
Chris Bassitt - +4.0% CSW%, -3.2 BB%
Hayden Birdsong - +2.0% CSW%, -1.9 BB%
Dustin May - +5.2% CSW%, -2.3 BB%
Austin Riley (ATL) 4 PA, 8 Swings, 2 Barrels, 1 HR
Francisco Lindor (NYM) 4 PA, 8 Swings, 2 Barrels, 2 HR
Jose Ramirez (CLE) 5 PA, 8 Swings, 2 Barrels, 1 HR
Zach Dezenzo (HOU) 4 PA, 4 Swings, 2 Barrels, 0 HR
Brendan Rodgers, Yesterday: 112.2 Previous High: 111.1
Brooks Baldwin, Yesterday: 107.1 Previous High: 106.8
Sean Murphy (ATL) - 112.5mph - home_run
Jordan Walker (STL) - 112.5mph - field_error
Brendan Rodgers (HOU) - 112.2mph - double
Jose Ramirez (CLE) - 111.3mph - single
Zach Dezenzo (HOU) - 110.9mph - double
Agustin Ramirez (MIA) - 110.4mph - double
Bo Naylor (CLE) - 110.2mph - nan
Matt Chapman (SF) - 109.7mph - field_out
Juan Soto (NYM) - 109.3mph - nan
Yordan Alvarez (HOU) - 108.9mph - single
Top 10
Salvador Perez - 95 PA, 0.236 wOBA, 0.385 xwOBA, 0.149 Diff
Dylan Crews - 73 PA, 0.224 wOBA, 0.347 xwOBA, 0.123 Diff
Andrew Vaughn - 83 PA, 0.214 wOBA, 0.321 xwOBA, 0.107 Diff
Brandon Lowe - 77 PA, 0.272 wOBA, 0.374 xwOBA, 0.102 Diff
Marcus Semien - 86 PA, 0.19 wOBA, 0.284 xwOBA, 0.094 Diff
Mike Trout - 88 PA, 0.336 wOBA, 0.426 xwOBA, 0.09 Diff
Max Muncy - 79 PA, 0.261 wOBA, 0.351 xwOBA, 0.09 Diff
Yordan Alvarez - 85 PA, 0.293 wOBA, 0.376 xwOBA, 0.083 Diff
Adolis Garcia - 83 PA, 0.323 wOBA, 0.405 xwOBA, 0.082 Diff
Alec Bohm - 94 PA, 0.216 wOBA, 0.293 xwOBA, 0.077 Diff
Bottom 10
Tyler Fitzgerald - 73 PA, 0.376 wOBA, 0.267 xwOBA, -0.109 Diff
Cedric Mullins II - 84 PA, 0.448 wOBA, 0.363 xwOBA, -0.085 Diff
Bryson Stott - 87 PA, 0.355 wOBA, 0.284 xwOBA, -0.071 Diff
Jose Altuve - 94 PA, 0.324 wOBA, 0.264 xwOBA, -0.06 Diff
Nolan Arenado - 88 PA, 0.358 wOBA, 0.3 xwOBA, -0.058 Diff
Michael Busch - 88 PA, 0.425 wOBA, 0.369 xwOBA, -0.056 Diff
Mookie Betts - 87 PA, 0.35 wOBA, 0.301 xwOBA, -0.049 Diff
Sal Frelick - 92 PA, 0.392 wOBA, 0.345 xwOBA, -0.047 Diff
Victor Scott II - 81 PA, 0.313 wOBA, 0.266 xwOBA, -0.047 Diff
Steven Kwan - 97 PA, 0.394 wOBA, 0.348 xwOBA, -0.046 Diff
Cal Raleigh - 77 PA, 46 BIP, 14 Brls, 30.4 Brl%
Mike Trout - 71 PA, 41 BIP, 11 Brls, 26.8 Brl%
Austin Riley - 75 PA, 48 BIP, 12 Brls, 25.0 Brl%
Ben Rice - 71 PA, 43 BIP, 10 Brls, 23.3 Brl%
Oneil Cruz - 60 PA, 35 BIP, 8 Brls, 22.9 Brl%
Pavin Smith - 58 PA, 31 BIP, 7 Brls, 22.6 Brl%
Pete Alonso - 81 PA, 58 BIP, 13 Brls, 22.4 Brl%
Shohei Ohtani - 68 PA, 45 BIP, 10 Brls, 22.2 Brl%
Kyren Paris - 51 PA, 27 BIP, 6 Brls, 22.2 Brl%
Fernando Tatis Jr. - 76 PA, 54 BIP, 12 Brls, 22.2 Brl%
Pete Alonso - 81 PA, 0.486 xwOBA
Fernando Tatis Jr. - 76 PA, 0.477 xwOBA
Marcell Ozuna - 61 PA, 0.477 xwOBA
Corey Seager - 64 PA, 0.472 xwOBA
Jonathan Aranda - 61 PA, 0.464 xwOBA
Mike Trout - 71 PA, 0.461 xwOBA
Shohei Ohtani - 68 PA, 0.455 xwOBA
Ben Rice - 71 PA, 0.453 xwOBA
Rafael Devers - 83 PA, 0.448 xwOBA
Vladimir Guerrero Jr. - 79 PA, 0.444 xwOBA
Luis Arraez - 75 PA, 127 Swings, 96.9 Cont%
Nico Hoerner - 68 PA, 117 Swings, 92.3 Cont%
Alex Call - 55 PA, 73 Swings, 91.8 Cont%
Steven Kwan - 79 PA, 121 Swings, 91.7 Cont%
Sal Frelick - 75 PA, 122 Swings, 89.3 Cont%
Brendan Donovan - 80 PA, 146 Swings, 88.4 Cont%
Geraldo Perdomo - 82 PA, 128 Swings, 88.3 Cont%
Santiago Espinal - 51 PA, 77 Swings, 88.3 Cont%
Jacob Wilson - 65 PA, 113 Swings, 87.6 Cont%
Alec Bohm - 74 PA, 130 Swings, 86.9 Cont%
Brice Turang - 7 Attempts (6 steals)
Xavier Edwards - 5 Attempts (3 steals)
Elly De La Cruz - 5 Attempts (4 steals)
Dylan Moore - 5 Attempts (3 steals)
Jose Caballero - 5 Attempts (3 steals)
Michael Harris II - 4 Attempts (4 steals)
Andres Gimenez - 4 Attempts (4 steals)
Corbin Carroll - 4 Attempts (4 steals)
Trea Turner - 4 Attempts (2 steals)
Sal Frelick - 4 Attempts (3 steals)
Randy Arozarena - 4 Attempts (4 steals)
Bryson Stott - 3 Attempts (3 steals)
Dylan Crews - 3 Attempts (3 steals)
Bobby Witt Jr. - 3 Attempts (2 steals)
Pete Crow-Armstrong - 3 Attempts (2 steals)
Johan Rojas - 3 Attempts (2 steals)
Jake Mangum - 3 Attempts (3 steals)
Maikel Garcia - 3 Attempts (1 steals)
Matt Chapman - 3 Attempts (2 steals)
Luisangel Acuna - 3 Attempts (3 steals)
Nick Allen - 3 Attempts (2 steals)
Oneil Cruz - 3 Attempts (3 steals)
Victor Scott II - 3 Attempts (3 steals)
Alek Thomas - 3 Attempts (3 steals)
William Contreras - 3 Attempts (3 steals)
Oneil Cruz - 10 Attempts (10 steals)
Dylan Moore - 9 Attempts (5 steals)
Elly De La Cruz - 9 Attempts (7 steals)
Sal Frelick - 9 Attempts (7 steals)
Brice Turang - 9 Attempts (8 steals)
Luis Robert - 9 Attempts (7 steals)
Pete Crow-Armstrong - 9 Attempts (8 steals)
Andres Gimenez - 8 Attempts (7 steals)
Jarren Duran - 8 Attempts (6 steals)
Victor Scott II - 8 Attempts (8 steals)
Trea Turner - 8 Attempts (6 steals)
Jose Caballero - 8 Attempts (5 steals)
Xavier Edwards - 8 Attempts (6 steals)
Jake Meyers - 8 Attempts (7 steals)
Jake Mangum - 8 Attempts (8 steals)
Bobby Witt Jr. - 8 Attempts (6 steals)
Corey Seager - 64 PA, 17.2 K%, 18.8 Brl%
Dylan Moore - 54 PA, 18.5 K%, 15.0 Brl%
Fernando Tatis Jr. - 76 PA, 17.1 K%, 22.2 Brl%
Jonathan Aranda - 61 PA, 16.4 K%, 20.9 Brl%
Pete Alonso - 81 PA, 14.8 K%, 22.4 Brl%
Rafael Devers - 83 PA, 19.3 K%, 21.8 Brl%
Seiya Suzuki - 60 PA, 18.3 K%, 19.5 Brl%
Shea Langeliers - 64 PA, 12.5 K%, 14.3 Brl%
Tyler Soderstrom - 74 PA, 18.9 K%, 17.3 Brl%
Pete Alonso - 98 PA, +0.133 xwOBA
Trevor Story - 93 PA, +0.115 xwOBA
Corbin Carroll - 103 PA, +0.108 xwOBA
Fernando Tatis Jr. - 98 PA, +0.108 xwOBA
Geraldo Perdomo - 99 PA, +0.103 xwOBA
Spencer Torkelson - 101 PA, +0.099 xwOBA
Tommy Edman - 84 PA, +0.098 xwOBA
Tyler Soderstrom - 94 PA, +0.09 xwOBA
Brendan Donovan - 98 PA, +0.085 xwOBA
Michael Busch - 81 PA, +0.078 xwOBA
Cal Raleigh - 97 PA, +13.5 Brl%
Austin Riley - 95 PA, +11.1 Brl%
Corbin Carroll - 103 PA, +10.5 Brl%
Kyle Stowers - 85 PA, +9.3 Brl%
James Wood - 95 PA, +8.7 Brl%
Fernando Tatis Jr. - 98 PA, +8.1 Brl%
Seiya Suzuki - 85 PA, +8.0 Brl%
Elly De La Cruz - 99 PA, +7.9 Brl%
Adolis Garcia - 83 PA, +7.8 Brl%
Anthony Volpe - 96 PA, +7.7 Brl%
Shea Langeliers - 80 PA, +10.9 Cont%
Pete Crow-Armstrong - 95 PA, +9.5 Cont%
Junior Caminero - 84 PA, +8.9 Cont%
Wilyer Abreu - 84 PA, +7.7 Cont%
JJ Bleday - 88 PA, +7.1 Cont%
Ian Happ - 108 PA, +7.1 Cont%
Josh Naylor - 95 PA, +6.6 Cont%
Paul Goldschmidt - 95 PA, +6.3 Cont%
Mark Vientos - 81 PA, +6.2 Cont%
Michael Busch - 81 PA, +5.8 Cont%
Shea Langeliers - 80 PA, -13.2 K%
Mark Vientos - 81 PA, -12.5 K%
Pete Alonso - 98 PA, -9.6 K%
Nolan Arenado - 88 PA, -8.8 K%
Kyle Schwarber - 102 PA, -8.7 K%
Lawrence Butler - 94 PA, -8.7 K%
Adolis Garcia - 83 PA, -8.5 K%
Ian Happ - 108 PA, -8.2 K%
Fernando Tatis Jr. - 98 PA, -7.8 K%
Ty France - 86 PA, -7.6 K%
Trea Turner - +4.6% Contact%, +3.2 mph exit velo, -11.6 Chase%
Matt Chapman - +5.8% Contact%, +6.9 mph exit velo, -7.4 Chase%
Fernando Tatis Jr. - +5.5% Contact%, +4.3 mph exit velo, -8.3 Chase%
Lawrence Butler - +9.9% Contact%, +3.9 mph exit velo, -6.2 Chase%
Corey Seager - +6.0% Contact%, +6.5 mph exit velo, -14.4 Chase%
Jake Meyers - +9.2% Contact%, +8.0 mph exit velo, -5.6 Chase%
Trevor Story - +3.4% Contact%, +5.7 mph exit velo, -3.5 Chase%
Triston Casas - +12.8% Contact%, +5.1 mph exit velo, -15.8 Chase%
Francisco Lindor - 0.41 xwOBA, 13.7% Brl%, 83.5% Contact%, 25.0% Chase%, 13.8% K%
Geraldo Perdomo - 0.442 xwOBA, 10.8% Brl%, 86.7% Contact%, 19.4% Chase%, 12.3% K%
Pete Alonso - 0.487 xwOBA, 16.3% Brl%, 79.6% Contact%, 23.9% Chase%, 14.8% K%
Vladimir Guerrero Jr. - 0.47 xwOBA, 14.3% Brl%, 83.1% Contact%, 23.8% Chase%, 8.9% K%
Yordan Alvarez - 0.442 xwOBA, 11.8% Brl%, 82.9% Contact%, 20.8% Chase%, 13.0% K%
Zac Veen - 42.5% Whiff%, 85.0% Weak%, 0.988 Cold Rating
Matt Mervis - 46.6% Whiff%, 70.6% Weak%, 0.928 Cold Rating
Harrison Bader - 35.4% Whiff%, 77.8% Weak%, 0.928 Cold Rating
George Springer - 35.0% Whiff%, 73.9% Weak%, 0.907 Cold Rating
Jordan Walker - 37.9% Whiff%, 70.4% Weak%, 0.888 Cold Rating
Jarred Kelenic - 40.9% Whiff%, 68.4% Weak%, 0.885 Cold Rating
Anthony Volpe - 37.0% Whiff%, 70.4% Weak%, 0.878 Cold Rating
Ceddanne Rafaela - 32.5% Whiff%, 72.0% Weak%, 0.868 Cold Rating
Maxwell Muncy - 31.3% Whiff%, 73.1% Weak%, 0.859 Cold Rating
Jazz Chisholm - 32.9% Whiff%, 69.7% Weak%, 0.844 Cold Rating
Edward Cabrera (3.0% Owned): Projected 5.75IP 2.27ER 6.18SO 2.22BB 17.62FPts
Nick Martinez (19.5% Owned): Projected 5.55IP 2.24ER 5.64SO 1.48BB 16.62FPts
Osvaldo Bido (5.5% Owned): Projected 5.39IP 2.3ER 4.69SO 1.73BB 14.19FPts
Gavin Lux - 34 PA, 1.31 OPS
Pavin Smith - 30 PA, 1.25 OPS
Austin Hays - 34 PA, 1.16 OPS
Eric Wagaman - 36 PA, 1.141 OPS
Jake Fraley - 29 PA, 1.115 OPS
Gavin Sheets - 28 PA, 0.989 OPS
Enmanuel Valdez - 34 PA, 0.983 OPS
Sal Frelick - 36 PA, 0.978 OPS
Griffin Conine - 28 PA, 0.953 OPS
Kyle Stowers - 33 PA, 0.946 OPS
Byron Buxton CF (29.5% Owned): Projected 0.82R 0.28HR 0.71RBI 1.1SO 0.26BB 0.1SB 9.87FPts
Pavin Smith RF (18.0% Owned): Projected 0.72R 0.22HR 0.77RBI 0.85SO 0.57BB 0.04SB 9.49FPts
Chandler Simpson SS (20.0% Owned): Projected 0.72R 0.12HR 0.48RBI 0.71SO 0.17BB 0.39SB 9.38FPts
Luis Rengifo 2B (24.5% Owned): Projected 0.76R 0.14HR 0.65RBI 0.61SO 0.26BB 0.19SB 9.24FPts
Jorge Soler LF (34.0% Owned): Projected 0.69R 0.26HR 0.81RBI 0.9SO 0.43BB 0.02SB 9.12FPts
Zach Neto SS (42.5% Owned): Projected 0.69R 0.18HR 0.71RBI 0.8SO 0.22BB 0.15SB 8.83FPts
Edouard Julien 2B (1.0% Owned): Projected 0.8R 0.15HR 0.58RBI 1.33SO 0.62BB 0.08SB 8.82FPts
Brandon Lowe 2B (36.0% Owned): Projected 0.65R 0.2HR 0.7RBI 1.07SO 0.34BB 0.05SB 8.78FPts
Trevor Larnach LF (1.5% Owned): Projected 0.62R 0.15HR 0.71RBI 0.97SO 0.52BB 0.04SB 8.32FPts
Dylan Crews OF (44.0% Owned): Projected 0.55R 0.16HR 0.6RBI 0.88SO 0.4BB 0.2SB 8.22FPts