
MLB Daily Notes - June 2
A daily automated report of what happened yesterday in Major League Baseball, along with other recent trends and further analysis

Check out yesterday’s box scores here

The Daily Notes are the flagship resource of MLB Data Warehouse. Every morning, Jon breaks down the current goings on in the fantasy baseball world, and an automated daily report gets you up to date on key stats and trends. Become a paid subscriber at MLB Data Warehouse to get this unlocked in your inbox every morning!
The beach is among the most overrated things in our very comfortable western lives. In your head it’s like YEAH I’ll go to the beach and sit there comfortably listening to the ocean and get in this maximum state of comfort and relaxation. In your head it’s 80 degrees and sunny and you’re drinking out of a coconut and you get a sick tan and all of the people around you are like “oh my goodness look at how cool and attractive that guy is. What’s that? He’s reading a book OMG he must be a Road Scholar. Wait what? He’s also a moderately successful fantasy baseball writer? Does he give autographs?? Is he married??” And then I have to like shoo all the women away because I’m in a perfect, happy, committed, heavenly marriage. And my wife acts mad about all the attention I’m getting but really she likes it because she’s so just happy to be married to a guy who is this level of elite. And then all the middle-aged men who see me come up begging to pay me cash for today’s BOOM hitters. But I give them away for free because I’m so far above the love of money.
But in reality you get here and it’s like 67 degrees and super windy and the ocean is 40 degrees and your kids get sand in crevices you didn’t even know existed. And then they get a splinter on the boardwalk and everything crashes down even further.
All of that is hyperbole, besides my marriage - that part is accurate. I have an 80-grade one of those (Gertrude, if you’re reading this - 80 is the max. It’s 100% of the max, not 80% like you’d think. I know it doesn’t make any sense but I don’t make the rules!).
I guess it’s our fault for coming in the first week of June rather than the peak of summer. But when you come in the peak of summer there are a million people here. So it’s a trade-off. Where’s that Thomas Sowell quote I always use?
And that all sounds a little bit complainy, and I’m not a complainer. But there’s truth in that and it was funny. And being funny is the most important thing you can be in situations like this.
I don’t even know what an ideal vacation for me would look like. I kinda just like sitting at home, listening to country music, writing baseball articles and watching the Pirates. So that’s the goal for today. Write a killer daily notes, win some double ups, and watch the Pirates beat Mike Burrows tonight while making my in-laws watch it with me and talking their ears off about how Burrows’ new sinker just isn’t what the Astros were thinking it would be.
Yesterdays Pitchers
You know who else is overrated? Jose Soriano. Seven walks last night! Seven.
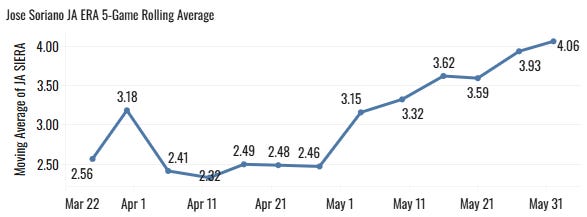
He threw 46% of his pitches for balls last night and couldn’t even get through five innings against the Road Rockies. Since May began, he has a 40.6% Ball%. For the year, he has the eighth-highest ball rate in the league.
Jacob Lopez 40.1%
Woods Richardson 40.0%
Landen Roupp 39.8%
Jack Kochanowicz 39.7%
Kyle Bradish 39.4%
Jack Flaherty 39.4%
Robbie Ray 38.9%
Jose Soriano 38.8%
Michael McGreevy 38.7%
Kumar Rocker 38.7%
That’s a pretty bad list of pitchers. It’s really tough to have success with a high ball rate. Soriano’s breakdown:
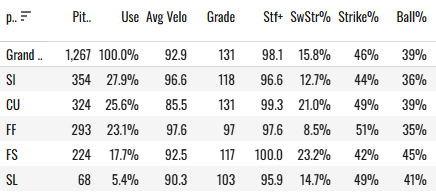
He just doesn’t have a fastball that gets strikes. The four-seamer has been good for him in that regard. That pitch usage is up and it has a good 51% Strike%. But it’s been hit hard with a .415 xwOBA against. So yeah, he can throw it in the zone, but too often he regrets doing so when some dude hits it 105mph into play.
Soriano’s been a disaster since we all took the bait on his elite start to the year. He still has a 2.72 ERA, but it’s 5.16 in his last seven starts as everything has kinda fallen apart.
He did get 22 whiffs last night. And there’s some correlation with that. When you’re throwing like 50% of your pitches outside of the zone, you won’t get a ton of contact when you get swings on it because the pitch is so far away from where the bat wants to be.
That’s a really wild line for Soriano. 108 pitches, 22 whiffs, seven strikeouts, seven walks. I suppose it didn’t kill your fantasy team last night with just the three hits and two earned runs added to it, but you shouldn’t be feeling good about his future at all. He sucks again!

Griffin Jax did something similar. 14 whiffs, a 19.4% SwStr%, but he got Jax’d up with three homers allowed to the Tigers.
4.0IP 7H 6ER 6R 5K 1BB
His last four starts: 22% K%, 8.8% BB%, 13.2% K-BB%, 4 HR, .356 xwOBA allowed
And this is a good general lesson for us. In most cases, relievers are just failed starters. If a team has a promising young pitching prospect, they typically make them starters. A relief pitcher gets you like 70 innings a year, one-third of what you can get from a stud starter. It’s just a volume calculation.
Jax was a starter back in 2021 and didn’t do well. The Twins made him a stud reliever, and now the Rays are trying to make him a decent starter. And I’d say a decent starter is probably more valuable than a stud reliever. But it’s not working too well for them right now.
We think of Garrett Crochet in these instances. The White Sox turned Crochet from a reliever to one of the game’s best starters, and the Red Sox practically got a Cy Young from him last year.
But he’s the exception, not the rule (and now we’re seeing the other part of that with Crochet where you’re subjecting yourself to a lot more injury risk as a starter). There are all kinds of examples of failed projects, but we forget about them because they flamed out and exited our memories. We should be very hesitant to buy into these types of conversions in the future.
We saw Landen Roupp above with a horrible ball rate. It all caught up to him last night.
4.0IP 8H 8ER 8R 4K 5BB
He walked five and gave up eight hits. That’s a 13 in the numerator of his WHIP. He didn’t give up a homer, so he kept his HR/9 elite at 0.42 for the year. But he has a 10% BB% this year, which is honestly lower than we should believe still.
Ball% predicts future BB% better than BB% itself does. Here’s my PROOF:
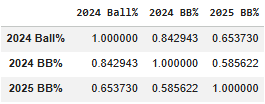
This is a correlation matrix between 2025% BB% and the previous year’s BB% and Ball%. The higher the number is to 1, the stronger the relationship between the two stats is. We have a 0.65 correlation coefficient between 2024 Ball% and 2025 BB%. For BB% vs. BB%, it’s 0.585. Stronger on the Ball% side by a decent margin.
The application of this is to look at the guys with the biggest gaps between their current 2026 BB% and Ball%. And we have a plot for that now.
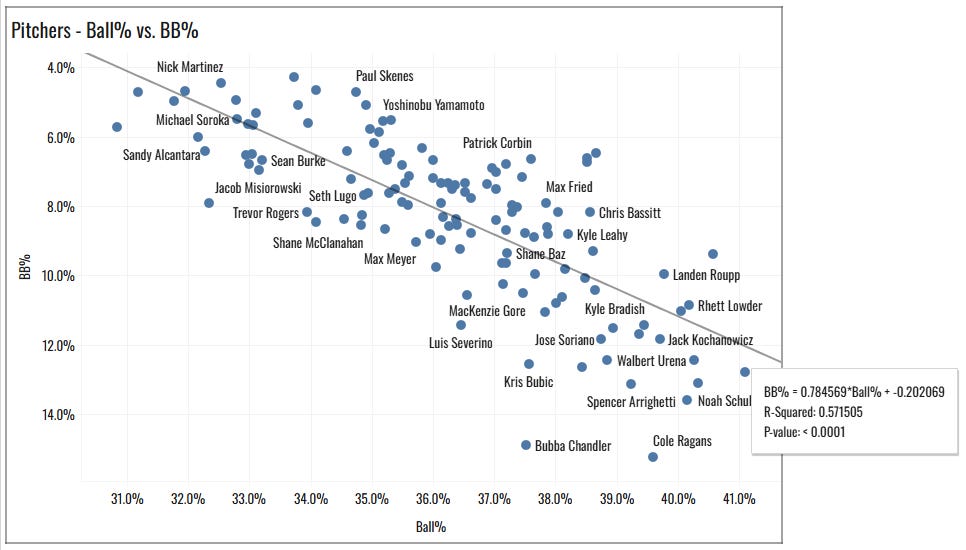
Scatter daddies can be tough to read. But we can use the trend line calculation to put the numbers on it:
I’m taking you back to high school algebra class. Maybe Algebra II. What we have here is a way to estimate BB% just by using Ball%.
The calculation is: Expected BB% = (0.78*Ball%)-0.2
So we get the Python script going:
data_26 = sav26.groupby(['player_name','pitcher'],as_index=False)[['PA_flag','IsWalk','PitchesThrown','IsBall']].sum()
data_26['Ball%'] = data_26['IsBall']/data_26['PitchesThrown']
data_26['BB%'] = data_26['IsWalk']/data_26['PA_flag']
data_26 = data_26.rename({'PA_flag': 'TBF'},axis=1)
data_26 = data_26[['player_name','pitcher','TBF','Ball%','BB%']]
data_26 = data_26[data_26['TBF']>=150]
data_26.columns=['Pitcher','ID','TBF','Ball%','BB%']
data_26['xBB%'] = (0.78*data_26['Ball%'])-.2
data_26['BB% Diff'] = data_26['BB%']-data_26['xBB%']
data_26 = data_26.round(3)
data_26 = data_26.sort_values(by='BB% Diff',ascending=False)
And now we have our result. Ten pitchers whose BB% are way lower than we’d expect given their Ball%:
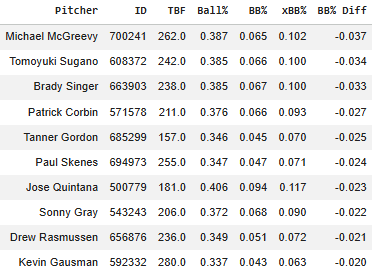
It’s our old nemesis Michael McGreevy at the top. He has a very bad 38.7% Ball%, but a very good 6.5% BB%. The expected BB% on a 38.7% Ball% is 10.2%.
This could speak to things other than randomness. Maybe some guys are just more willing to go out of the zone early in counts. More willing to go to 2-0 than other guys, so they save their true strike-throwing abilities for when they need it most. Or maybe it has something to do with hitter aggression. They just might not want to take a walk against the guy because they know they can pummel his crappy stuff, so they’re more willing to swing when ahead in the count.
But the point remains - future BB% will regress more toward current Ball% than to current BB%. So it’s wise to expected higher BB% moving forward for those guys.
Flipping it around:
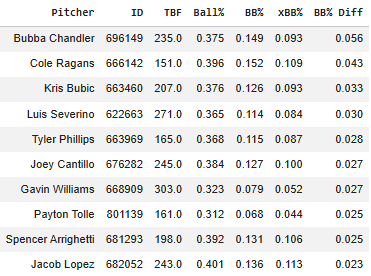
Here you have a list of super high walk rates. Bubba Chandler has an awful 14.9% BB%, but his expectation given his 37.5% Ball% would be 9.3%. He’s really not been able to executed pitches in three-ball counts. And that should regress positively. A 9.3% BB% for Bubba would make him a good pitcher, I think. And maybe that’s some of what the Pirates are seeing while they’ve stuck with him through Jared Jones’ return. I really thought he’d be sent down to AAA by now. But he’ll start tonight against the Astros.
Gavin Williams and Payton Tolle are interesting here because they both already have good walk rates (7.9% for Williams, 6.8% for Tolle). But this simple regression model would say they should improve even further on the BB%. A 5.2% BB% on Williams and 4.4% on Tolle would make both of them stud pitchers, and they both kind of already are.
You can use this for betting purposes, if that’s your cup of tea. My guess is that the books are mostly using BB% plus league-wide natural regression to calculate their prices. They could be using Ball%, I guess, but I somewhat doubt it. I looked for a Chandler walks line on DraftKings, and we don’t have one yet. But that’s something you can look for. Betting the overs on the first group of pitchers we saw and the unders on the second group.
here’s that scatter plot (updated daily)
Another cool thing you can do with the dashboard, that you can’t do anywhere else, is look at Ball% by count. I like to set the balls to three and then check the Ball% count. So this will give you the ball rates in three-ball counts:
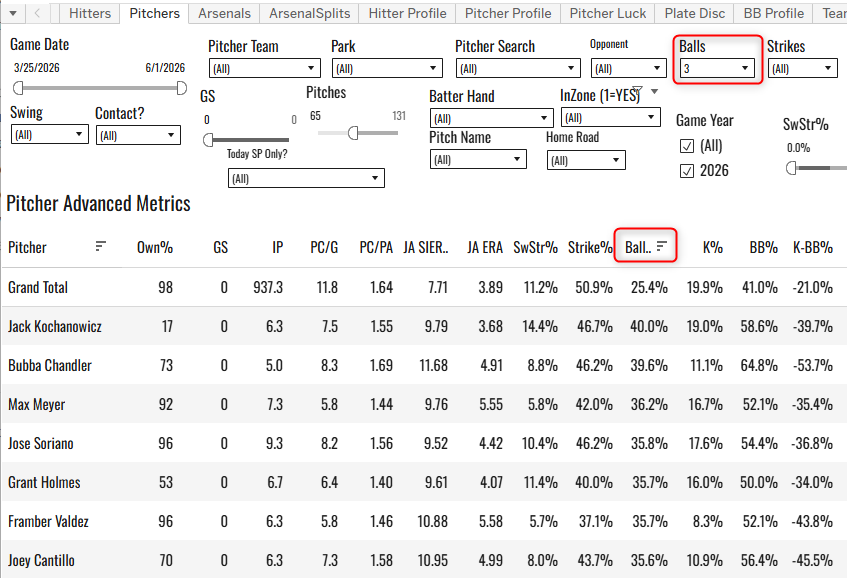
We see Bubba Chandler here again. A 39.6% Ball% in three ball counts. The league average is 25%. He throws balls at a higher rate in three-ball counts than non three-ball counts. And you might think that’s a bad thing. And it is. You’ve gotta throw strikes in all counts, especially the 3-ball ones. But in another way, it’s good news. He’s overwhelming more likely to improve on this than to get worse or stay the same. His BB% is going to drop as the sample size grows.
The lowest Ball% in three-ball counts this year:
Wheeler 13.6%
Gausman 14.8%
Taillon 15.4%
McGreevy 17.5%
Ryan 17.7%
Luzardo 17.8%
Gallen 17.8%
Hancock 18.0%
Yamamoto 18.0%
Skenes 18.1%
There’s skill involved here, as you can tell by the quality of pitchers on this list. Wheeler, Gausman, Ryan, Skenes - these are some of the best pitchers in the league. They have spectacular command and can throw the ball where they want to. I checked Wheeler last year and he was elite at 15.4%. So okay, you win Wheeler!
Gausman was at 25% last year, though. So he’s ten points better than this year.
So I’ll finish this side-bar I’m spending 45 minutes with two predictions:
Bubba Chandler’s 15% BB% will come down rapidly
Kevin Gausman’s 4.3% BB% will come up rapidly
We didn’t have to do all that to arrive at the conclusion. We could have just looked at their career walk rates and expected them to regress toward that.
But that was kinda fun and informative… right?
Speaking of the beach, David Sandlin put a 79mph ice cold wind in my face after I stupidly streamed in last night.
4.0IP 8H 8ER 8R 4K 4BB
What a jag. Four walks and he gave up a grand slam. Hate that guy now, and I only heard of him six days ago.
Sandy Alcantara gave up two earned runs immediately but finished strong. He also has the word “sand” in his name, so this theme is really running strong today.
7.0IP 7H 3ER 3R 5K 0BB
He must have just gotten pissed or something. He threw his fastballs way harder last night.
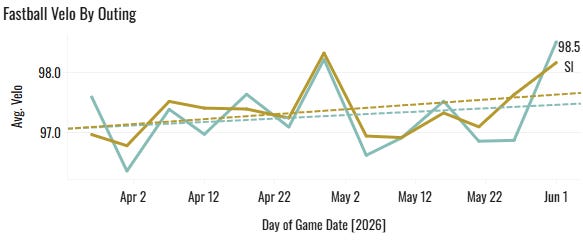
Averaged more than 98mph on both of them (four-seam and sinker).
That was his second spike of the year. The first time was April 29th when he went six strong innings giving up just two earned runs against the Dodgers.