The Daily Notes are the flagship resource of MLB Data Warehouse. Every morning, Jon breaks down the current goings on in the fantasy baseball world, and an automated daily report gets you up to date on key stats and trends. Become a paid subscriber at MLB Data Warehouse to get this unlocked in your inbox every morning!
Boxscore is the newspaper sports page in your inbox every morning: box scores, standings, and league leaders, in plain text. No hot takes, no narrative, just the numbers. Subscribe for free at boxscore.email.
Some of you are new here because you subscribed after seeing my HR model picks and stats about the awesome June the model has had. You probably thought I really had something going here, and you probably took some of the HR picks from yesterday. And then the picks went literally 0/16. Not a single recommended guy hit a homer. And now you think I’m a total snake. It was very unfortunate timing for one of the worst days of the season for those picks. But that’s what you get when you try to be a gambling bro.
You probably shouldn’t be expecting to make money betting home runs at all. It’s possible to do, but long term it’s no viable. You have to be really on top of odds shopping and buying the right lines and not taking the bad lines. And you have to then somehow not get limited/bans by the book if you do strike the right chord. But if you are successful, it certainly won’t be a situation where you’re adding 2-3 units every day. It’s like loss loss loss HUGE WIN loss WIN loss loss loss BIG WIN… that’s kinda how it seems to go to me.
Every year it’s a TEMPTATION to me. The big money you can make in the baseball content game is definitely through pretending you’re a proven winner sports bettor and then start selling picks. I can’t do that, because I don’t believe it. I’m not a winning sports bettor. I don’t really bet that often, I don’t take that seriously, I spend my time on other things. So I’m not going to pretend that I can help people win.
But I do think it’s at least possible, and especially if you’re using projections the right way. And I’ll stand behind my projection model. I just don’t want to get into the game where you have to start exagerrating or lying to sell stuff to people who will probably end up losing money. So I’ll keep on just giving tools and projections and telling people the truth - none of this is proven to win long term (it’s not proven not to either, I just have never really cared to test things fully).
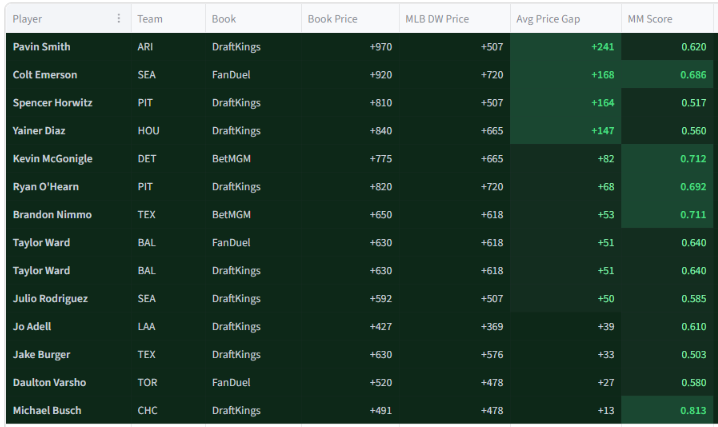
And the books hold the trump card at the end of the day. If you start beating them, they no longer take your business. So don’t quit your jobs, guys. If you want the HR picks from today, though, here they are:
It compares my projections and the matchups model and highlights all of the guys whose projected price beats what’s being offered on the books, and for a double-check, it filters down to the guys who have numbers we like in their matchup with today’s SP.
I like being a podcast guy. Podcasts are fun. I have no idea if I’m good at it or not. I think I’m pretty good at verbalizing and articulating things, but I’m pretty sure I’m really boring to listen to and a bit scatter-brained. But we’re back into it now. And I can’t really paywall podcasts. So they’re always free.
Two from yesterday:
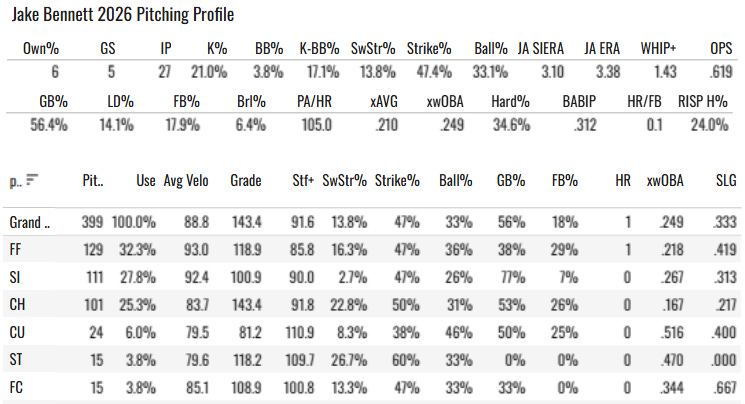
But let’s talk about baseball from yesterday. The projections were pretty positive on Jake Bennett, and he went out there and had one of the best starts of the year in Coors Field.
→ 6.0IP 4H 0ER 0R 9K 0BB
15 wihffs, a 20.8% SwStr%. That’s not easy to do in any matchup, but this guy did it in Coors!
Benny now has a 3.71 ERA with a 1.13 WHIP in five MLB starts. 22 strikeouts, five walks; that’s a 16% K-BB%, and he’s given up all of one homer in his 26.2 innings, and NONE in his last four starts. So is he good?
He’s 25 years old, so that’s mostly a good sign. He’s not a young breakout prospect, but he’s young enough to where there’s plenty of upside left.
The key stats = 56% GB%, 13.8% SwStr%, 33% Ball%
That gives him a competitive 3.38 JA ERA. The fastball has been awesome with a 16.3% SwStr%. But the Stuff+ at 86 (doesn’t include last night) is a worry. Say what you will about Stuff+, but one thing we can say is that it’s pretty good at predicting whiffs from fastballs.
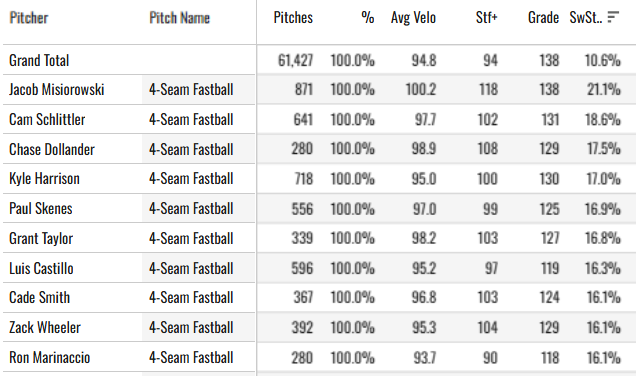
Here’s everyone with 250+ FF thrown and a SwStr% above 16%.
Only one name has a Stuff+ below 95, and the average of that group is 104. Bennett being as low as he would make you think the small-sample SwStr% is pretty fake.
But okay, with a 4% BB% and a 56% GB%, you don’t have to get a ton of strikeouts to matter. I’m thinking that Bennett is better than we thought a month ago, but I’d still be pretty hesitant to buy in on him in a 10-12 team league. But he’s worth a look if you’re hurting at SP.
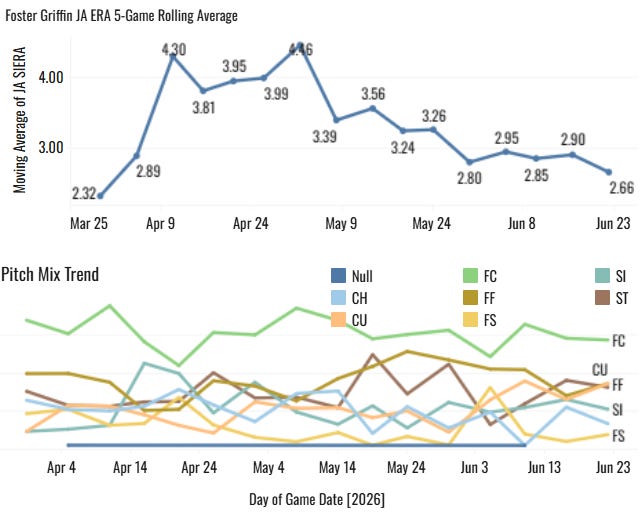
A 9:0 K:BB from Griffin, who continues his pleasantly surprising season. He’s crushing in June.
Foster Griffin in June
4 GS, 24.1 IP, 1.48 ERA, 0.82 WHIP, 25.5% K%, 2.1% BB%
The pitch mix is so deep. He’s thrown six different pitches at least 10% of the time this year. You really don’t know what’s coming, and suddenly he’s throwing them mostly all for strikes.
The four-seamer in June has a 14.1% SwStr% with a .238 xwOBA allowed at 30% usage. That’s the only pitch above 20% usage. So you can kinda sit on that one a bit, but really you have no idea what’s coming from the guy. The Stuff+ is not good at 94 overall and 91.5 on the four-seamer. But he makes up for it with the depth of arsenal we’re talking about and a decent 49% GB%.
He’s 86% owned, and if you jumped on him right away in your league you’re profiting hugely from him. He’s in the tp 20 on the player rater, ahead of guys like Parker Messick, Gavin Williams, and Joe Ryan. Nice pitcher there, good job by the Nationals getting him for cheap.
Everything went backwards yesterday. The story of the day was BE AFRAID OF NON-ELITE PITCHERS BECAUSE HITTING STATS ARE THROUGH THE ROOF! And then the league hits 16 homers for a 1.86% HR% on the day. That’s baseball for ya.
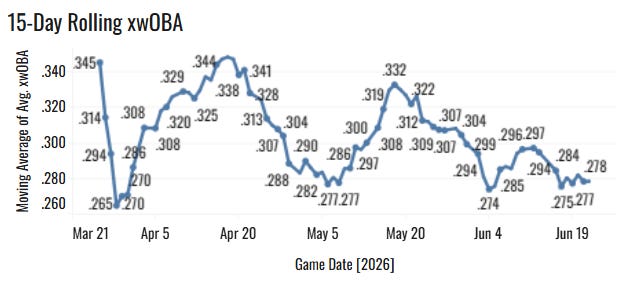
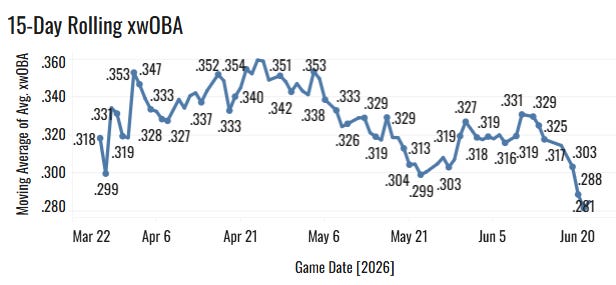
We were on Kay in DFS big time, and that paid off massively. Great start for Kay, taking advantage of this terrible Guardians lineup. Check out Cleveland’s 15-day rolling xwOBA:
Kay had a 14.9% SwStr% and a huge 55.4% Strike%. He came right at the Guards, as he should have, and it paid off.
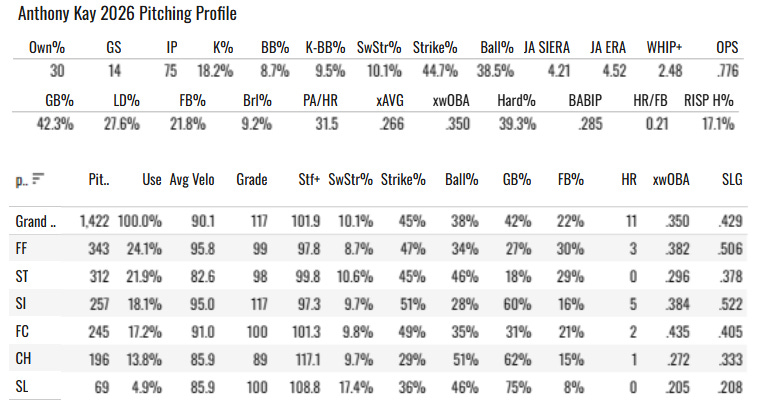
Kay’s page:
Nothing you really like here. A 9.5% K-BB% with a .350 xwOBA. That’s always a deadly combo, in a bad way.
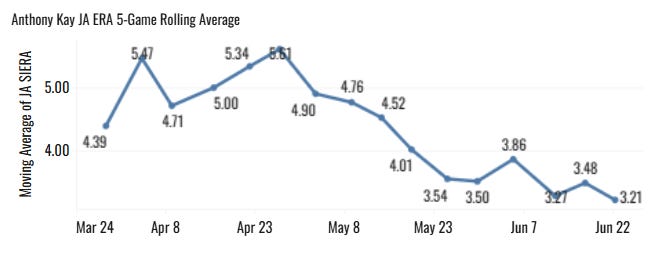
But at least he’s getting better:
He’s really good against lefteis with a 31% K%, 8% B%, and .268 xwOBA. But that doesn’t help starting pitchers very much because most teams can stack 7-8 righties against you.
So which teams are the MOST right handed and left handed? Have you ever wondered that? Probably not! But now you’ll find out. We can make a quick table in TABLEAU, or wherever you want, that gets the team’s share of PAs taken by righties and lefties. Switch hitters complicate things a bit, and that’s what we see with the Guardians.
HIGHEST SHARE OF PAs TAKEN BY LEFT HAND HITTERS
CLE 72%
WSH 66%
NYY 61%
SEA 59%
LAD 58%
The Guardians have a few switch hitters and they really focus closely on platoons. That’s what you want to do if you don’t have a great collection of hitters. You just mash pairs of them together to get the most out of the duo.
So the Guardians can get lefties in the lineup when the starter is right-handed (which is about two-thirds of the league starters) and you see that playing out there. It hasn’t really helped them, as they still aren’t hitting well, but hey - they have a winning record.
HIGHEST SHARE OF PAs TAKEN BY RIGHT HANDED HITTERS
HOU 75%
LAA 74%
SD 71%
CIN 68%
There’s a huge gap after those four. CHC is at 59% and TOR is at 58% to be the next two.
This seems to be bad news, as these four offenses are struggling. They aren’t able to get the left-handed bats in the lineup when a righty is on the hill.
Nice bounce back for the big man. Eight strikeouts against the White Sox with 14 whiffs and a 14.7% SwStr%. He continues to throw strikes. I think he’s a glaring buy-low right now.
Shoved it in against the Yankees. The Yanks are beatable with lefties while Judge is out, and we saw that from Framber. He’s been pretty good since his rough start. His last six:
34.2 IP, 2.86 ERA, 1.21 WHIP, 21% K%, 9% BB%, 1.04 HR/9
Still not a very good K-BB% by any means, but the ball is staying in the yard and he’s thrown at least five innings in each of these starts.
He’s pretty tough to trust start-to-start, but he’s more or less doing his usual thing lately.
His GB% is down to 53%, which is still high - but he’s been a guy in the sixties in the past.
We don’t love the guy. I don’t think I’d want to start him in a ten-teamer, but he’s at least providing quality volume now.
Bradish is back, I guess! He was a DFS staple last time (we cashed all over the place, it’s been a great DFS run the last couple of weeks), and he didn’t disappoint against the Angels.
Nine strikeouts, one walk, the slider was wicked with a 25.7% SwStr%. He still didn’t get whiffs with the sinker (2.3%), but the Angels couldn’t take advantage of the badness of that pitch in the 44 offerings.
Bradish in June:
29% K%, 9% BB%, 12.5% SwStr%, 36% Ball%
Still not utterly dominant, but the slider/curve are crushing. The bad fastballs will keep holding him down and resulting in some bad starts, but for awhile there even his breaking balls weren’t doing great - and that seems to be fixed now.
This freakin’ guy…
He didn’t need a real rehab stint, he didn’t need fastball velocity, he just went out there, struck out 10 of the 19 hitters he faced and gave up one hit on the nine balls in play he allowed. They were all hit in the air. He had a 0% GB%. That’s funny to see.
The fastballs were fooling guys, I guess, and the changeup put a couple of guys away. Very impressive return from Woodruff.
I guess it’s just like a rule that if you’re a Brewers pitcher and not in the hospital, you’re an ace.
He’s not very good! He got thumped to a .387 xwOBA and a homer yesterday with just a 12.4% SwStr%. That’s not a terrible SwStr%, and he threw a lot of strikes once again (31.5% Ball%), but he’s just hittable now.
The four-seamer has only been hit out of the yard once this year with a .298 xwOBA. His xwOBAs are all very low, actually. A .266 overall. That’s very good.
He’s given up five homers, one on every pitch type he’s thrown. So I guess it’s not a problem of getting hit hard.
It’s actually more that he’s just not getting whiffs reliably. An 8.9% SwStr%. He’s not the Cole of old. I suppose you should hold on for awhile longer if you have him, he has three really good starts out of six tries. So that’s fine. Maybe I’m being too harsh.
A bad pitcher who went out into a bad ballpark with bad pitching weather and he shoved. You can’t predict BALL!
Didn’t see that coming! Seven strong for King with five strikeouts and no walks. He took advantage of the struggling Braves lineup.
The Braves:
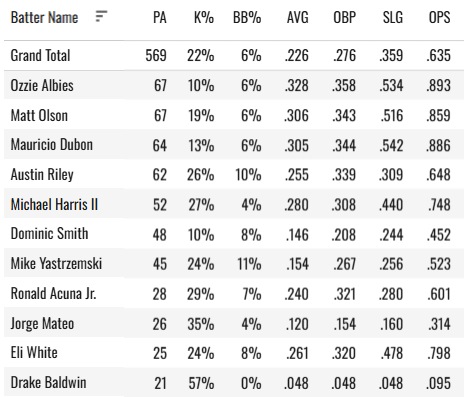
They are hitting .226/.276/.359 in June with 16 homers for a pretty mediocre 36 PA/HR. They’re missing Acuna badly, and nobody beisdes Albies, Olson, and Dubon are hitting. June stats here:
Drake Baldwin is zero for his last four games since returning from the IL and homering in his first PA.
Five walks, I just wanted to make fun of him.
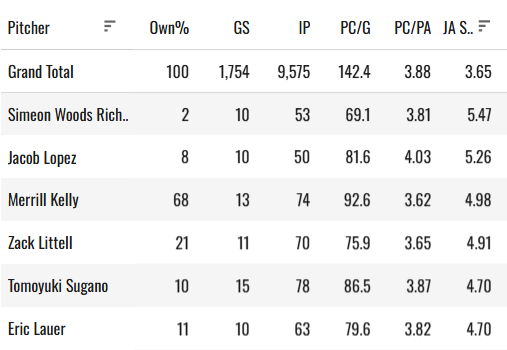
I would just like to point out that Merrill Kelly is one of the worstp itchers in the league this year. He has a 13% K% with a 9% BB% and a .401 xwOBA allowed. That’s a 4.48 JA ERA. Horrible stuff.
He has the highest JA SIERA of any pitcher with at least 11 starts. If you limit it to ten starts like a normal person would, SWR and Jacob Lopez come in above him.
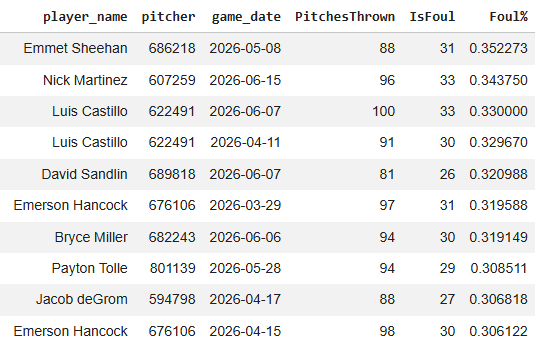
Arm tattoo guy threw 85 pitches and got nine outs before they had to call it quits. Somehow he had a 52.9% Strike%. He walked just two. That doesn’t make any sense. How did this happen? Did he give up a million foul balls?
I bet he’s among the leaders in most foul balls this year. LET’S FIND OUT.
He’s NOT. He gave up 20 foul ball son 85 pitches, that’s a rate of 23.5%. Nowhere near the top:
He must have just gone to a bunch of full counts or something. I don’t know, that seems like a really random start and I don’t think you should be worried about it if you have Brown.
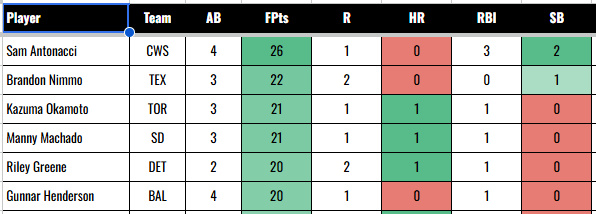
There really was not much offense last night. Only six hitters above 20 points:
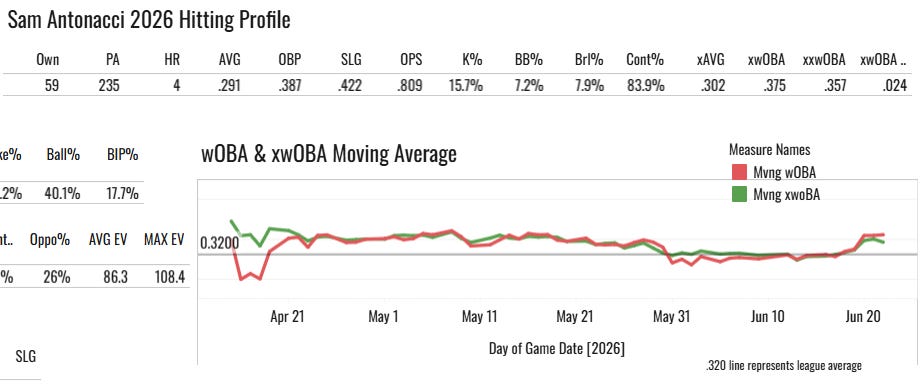
Sam Antonacci has been awesome. He’s hitting .289/.390/.397 now with three homers and 11 steals in 58 games. That’s something like a ten-homer, 25-steal season pace. With the high batting average, this guy is obviously a must-own and probably a top ten second baseman the rest of the way home.
There’s not much raw powere here (102 EV90 on fly balls), and that’s why you see just three homers and a 7.9% Brl% (I believe one homer was inside the park). But he can hit you a couple homers a month with steals and a high batting average, and here’s their lead-off man now.
Check out the below automated reports for a lot more!
1. Jake Bennett
2. Foster Griffin
3. Anthony Kay
4. Gavin Williams
5. Brandon Woodruff
6. Brady Singer
7. Dylan Cease
8. Framber Valdez
9. Kyle Bradish
10. Gerrit Cole
11. Ryan Feltner
12. Hunter Brown
13. Tyler Phillips
14. Michael King
15. Drew Rasmussen
16. Grant Holmes
17. Michael Wacha
18. Zebby Matthews
19. Samuel Aldegheri
20. Merrill Kelly
21. Andre Pallante
1. Kyle Bradish (vs. LAA): 35.8 Points
2. Foster Griffin (vs. PHI): 34.09 Points
3. Brandon Woodruff (vs. CIN): 32.9 Points
4. Jake Bennett (vs. COL): 29.1 Points
5. Framber Valdez (vs. NYY): 27.9 Points
6. Brady Singer (vs. MIL): 27.35 Points
7. Anthony Kay (vs. CLE): 26.5 Points
8. Michael King (vs. ATL): 26.15 Points
9. Michael Wacha (vs. TB): 23.55 Points
10. Kumar Rocker (vs. MIA): 22.25 Points
1. Kumar Rocker (TEX): 20 Whiffs (76 Pitches)
2. Foster Griffin (WSH): 17 Whiffs (105 Pitches)
3. Anthony Kay (CWS): 15 Whiffs (101 Pitches)
4. Jake Bennett (BOS): 15 Whiffs (72 Pitches)
5. Gavin Williams (CLE): 14 Whiffs (95 Pitches)
6. Brady Singer (CIN): 13 Whiffs (106 Pitches)
7. Framber Valdez (DET): 13 Whiffs (94 Pitches)
8. Kyle Bradish (BAL): 13 Whiffs (101 Pitches)
9. Dylan Cease (TOR): 12 Whiffs (110 Pitches)
10. Gerrit Cole (NYY): 11 Whiffs (89 Pitches)
1. Brandon Woodruff (MIL): 55.7 Strike%, 32.9 Ball%
2. Anthony Kay (CWS): 55.4 Strike%, 31.7 Ball%
3. Foster Griffin (WSH): 53.3 Strike%, 29.5 Ball%
4. Hunter Brown (HOU): 52.9 Strike%, 36.5 Ball%
5. Jake Bennett (BOS): 52.8 Strike%, 30.6 Ball%
6. Kumar Rocker (TEX): 52.6 Strike%, 34.2 Ball%
7. Gavin Williams (CLE): 51.6 Strike%, 36.8 Ball%
8. Dylan Cease (TOR): 50.9 Strike%, 39.1 Ball%
9. Brady Singer (CIN): 50.0 Strike%, 34.9 Ball%
10. Gerrit Cole (NYY): 49.4 Strike%, 31.5 Ball%
11. Alan Rangel (PHI): 48.6 Strike%, 29.2 Ball%
12. Tyler Phillips (MIA): 48.3 Strike%, 32.6 Ball%
13. Framber Valdez (DET): 47.9 Strike%, 37.2 Ball%
14. Drew Rasmussen (TB): 47.8 Strike%, 33.3 Ball%
15. Kyle Bradish (BAL): 46.5 Strike%, 33.7 Ball%
1. Jake Bennett: 72 Pitches, 18 Outs, 4.0 POUT
2. Kyle Bradish: 101 Pitches, 24 Outs, 4.21 POUT
3. Brandon Woodruff: 79 Pitches, 18 Outs, 4.39 POUT
4. Michael King: 93 Pitches, 21 Outs, 4.43 POUT
5. Eric Lauer: 84 Pitches, 18 Outs, 4.67 POUT
6. Michael Wacha: 99 Pitches, 21 Outs, 4.71 POUT
7. Foster Griffin: 105 Pitches, 22 Outs, 4.77 POUT
8. Alan Rangel: 72 Pitches, 15 Outs, 4.8 POUT
9. Drew Rasmussen: 90 Pitches, 18 Outs, 5.0 POUT
10. Andre Pallante: 85 Pitches, 17 Outs, 5.0 POUT
Gavin Williams’s SI velo (33 pitches) UP 1.6mph to 97.8
Brandon Woodruff’s FF usage (51.9%) up 16.2 points
Drew Rasmussen’s CH usage (18.9%) up 14.0 points
Gavin Williams’s SI usage (34.7%) up 23.7 points
Grant Holmes’s SI usage (29.7%) up 26.1 points
Hunter Brown’s SI usage (37.6%) up 14.1 points
Hunter Brown’s SL usage (16.5%) up 11.4 points
Kumar Rocker’s SL usage (51.3%) up 20.4 points
Kyle Bradish’s SI usage (43.6%) up 10.6 points
Slade Cecconi Slider: +21.0%
Logan Gilbert 4-Seam Fastball: +20.2%
Tanner Bibee Sinker: +19.8%
Joey Cantillo 4-Seam Fastball: -18.7%
Logan Webb Sinker: -17.8%
Griffin Jax 4-Seam Fastball: -16.6%
Roki Sasaki Split-Finger: +16.6%
Brandon Woodruff 4-Seam Fastball: +16.0%
Slade Cecconi 4-Seam Fastball: -15.5%
Gavin Williams Sinker: +15.3%
Joey Cantillo Cutter: +15.3%
Stephen Kolek Slider: +14.7%
Kumar Rocker Sinker: -14.7%
Roki Sasaki Forkball: -14.4%
Bubba Chandler 4-Seam Fastball: -13.6%
Andrew Painter 4-Seam Fastball: -13.2%
Jose Soriano Sinker: -13.1%
Kyle Freeland Sweeper: -13.1%
Tanner Bibee 4-Seam Fastball: -12.9%
Joey Cantillo Curveball: +12.8%
Gavin Williams 4-Seam Fastball: -12.7%
Casey Mize Split-Finger: -12.4%
Brandon Sproat 4-Seam Fastball: +12.3%
Bryce Elder Sinker: +12.2%
Kai-Wei Teng 4-Seam Fastball: +12.1%
Scott Barlow - 55.0 RISP H%, 0.444 BABIP, 33.0 HR/FB, 189.0 Luck Score
Tatsuya Imai - 40.0 RISP H%, 0.529 BABIP, 33.0 HR/FB, 185.0 Luck Score
Bryce Elder - 36.0 RISP H%, 0.463 BABIP, 38.0 HR/FB, 185.0 Luck Score
Emmet Sheehan - 25.0 RISP H%, 0.409 BABIP, 43.0 HR/FB, 168.0 Luck Score
Chad Patrick - 25.0 RISP H%, 0.4 BABIP, 50.0 HR/FB, 166.0 Luck Score
Andrew Painter - 46.0 RISP H%, 0.333 BABIP, 29.0 HR/FB, 164.0 Luck Score
Cade Cavalli - 30.0 RISP H%, 0.36 BABIP, 33.0 HR/FB, 162.0 Luck Score
Gavin Williams - 38.0 RISP H%, 0.316 BABIP, 40.0 HR/FB, 161.0 Luck Score
Patrick Corbin - 35.0 RISP H%, 0.417 BABIP, 22.0 HR/FB, 161.0 Luck Score
Jack Leiter - 40.0 RISP H%, 0.387 BABIP, 22.0 HR/FB, 160.0 Luck Score
Gage Jump - 0.0 RISP H%, 0.214 BABIP, 0.0 HR/FB, 17.0 Luck Score
AJ Blubaugh - 0.0 RISP H%, 0.238 BABIP, 0.0 HR/FB, 23.0 Luck Score
Shota Imanaga - 0.0 RISP H%, 0.25 BABIP, 0.0 HR/FB, 26.0 Luck Score
Peter Lambert - 0.0 RISP H%, 0.121 BABIP, 16.0 HR/FB, 34.0 Luck Score
Logan Webb - 6.0 RISP H%, 0.246 BABIP, 5.0 HR/FB, 34.0 Luck Score
Keider Montero - 8.0 RISP H%, 0.234 BABIP, 8.0 HR/FB, 35.0 Luck Score
Grant Holmes - 14.0 RISP H%, 0.217 BABIP, 0.0 HR/FB, 37.0 Luck Score
Tanner Bibee - 0.0 RISP H%, 0.12 BABIP, 18.0 HR/FB, 37.0 Luck Score
Ranger Suarez - 14.0 RISP H%, 0.233 BABIP, 0.0 HR/FB, 39.0 Luck Score
Jacob Misiorowski - 17.0 RISP H%, 0.214 BABIP, 0.0 HR/FB, 39.0 Luck Score
Jacob Misiorowski - 80 TBF, 37.0% CSW%
Jesus Luzardo - 79 TBF, 33.6% CSW%
Brady Singer - 91 TBF, 33.1% CSW%
Dustin May - 87 TBF, 33.0% CSW%
Dylan Cease - 68 TBF, 32.8% CSW%
Jack Perkins - 82 TBF, 32.5% CSW%
Kyle Harrison - 84 TBF, 32.5% CSW%
Chris Sale - 77 TBF, 32.4% CSW%
Kyle Bradish - 100 TBF, 32.4% CSW%
Sean Burke - 68 TBF, 32.2% CSW%
Dylan Cease - 68 TBF, 38.2% K%
Jacob Misiorowski - 80 TBF, 37.5% K%
Drew Rasmussen - 96 TBF, 35.4% K%
Paul Skenes - 95 TBF, 33.7% K%
Logan Gilbert - 92 TBF, 33.7% K%
Chase Burns - 91 TBF, 33.0% K%
Kyle Harrison - 84 TBF, 31.0% K%
Sean Burke - 68 TBF, 30.9% K%
Zack Wheeler - 95 TBF, 30.5% K%
Carlos Rodon - 70 TBF, 30.0% K%
Jacob Misiorowski - 80 TBF, 32.5% K-BB%
Drew Rasmussen - 96 TBF, 32.3% K-BB%
Paul Skenes - 95 TBF, 27.4% K-BB%
Logan Gilbert - 92 TBF, 27.2% K-BB%
Kyle Harrison - 84 TBF, 26.2% K-BB%
Dylan Cease - 68 TBF, 25.0% K-BB%
Cam Schlittler - 94 TBF, 24.5% K-BB%
Dustin May - 87 TBF, 24.1% K-BB%
Bryan Woo - 75 TBF, 24.0% K-BB%
Foster Griffin - 94 TBF, 23.4% K-BB%
Framber Valdez - 96 TBF, 66.7% GB%
Jose Soriano - 70 TBF, 61.2% GB%
Andrew Alvarez - 73 TBF, 58.7% GB%
Will Warren - 69 TBF, 58.7% GB%
Andre Pallante - 95 TBF, 58.6% GB%
Yoshinobu Yamamoto - 79 TBF, 58.3% GB%
Walbert Urena - 98 TBF, 56.5% GB%
Cristopher Sanchez - 101 TBF, 56.3% GB%
Justin Wrobleski - 66 TBF, 55.6% GB%
Walker Buehler - 87 TBF, 54.1% GB%
Andrew Morris - 49 TBF, 36.7 K%, 6.1 BB%, 59.3% GB%
Chad Patrick - 58 TBF, 29.3 K%, 5.2 BB%, 50.0% GB%
Drew Rasmussen - 96 TBF, 35.4 K%, 3.1 BB%, 44.8% GB%
Dustin May - 87 TBF, 29.9 K%, 5.7 BB%, 48.2% GB%
Jacob Misiorowski - 80 TBF, 37.5 K%, 5.0 BB%, 46.7% GB%
Jake Bennett - 63 TBF, 28.6 K%, 0.0 BB%, 47.7% GB%
Louis Varland - 44 TBF, 36.4 K%, 6.8 BB%, 52.0% GB%
Paul Skenes - 95 TBF, 33.7 K%, 6.3 BB%, 47.3% GB%
Drew Rasmussen - +2.5% CSW%, -2.4 BB%
Andre Pallante - +3.1% CSW%, -4.4 BB%
Kumar Rocker - +2.1% CSW%, -2.7 BB%
Jacob Misiorowski - +3.1% CSW%, -3.5 BB%
Roki Sasaki - +3.0% CSW%, -1.7 BB%
Martin Perez - +2.6% CSW%, -2.4 BB%
Dustin May - +4.1% CSW%, -3.3 BB%
Brent Suter - +5.1% CSW%, -3.6 BB%
Luis Medina - +7.8% CSW%, -1.5 BB%
Amed Rosario (NYY) 5 PA, 9 Swings, 2 Barrels, 1 HR
Byron Buxton (MIN) 4 PA, 12 Swings, 2 Barrels, 1 HR
Royce Lewis (MIN) 4 PA, 9 Swings, 2 Barrels, 0 HR
Junior Caminero (TB) - 115.8mph - field_out
Rodolfo Duran (SD) - 114.8mph - None
Alec Burleson (STL) - 114.6mph - None
Coby Mayo (BAL) - 113.0mph - home_run
Corbin Carroll (ARI) - 112.9mph - double
Shohei Ohtani (LAD) - 112.8mph - home_run
Jake Burger (TEX) - 111.4mph - field_out
Austin Riley (ATL) - 110.3mph - single
Byron Buxton (MIN) - 110.0mph - None
Tommy Troy (ARI) - 109.9mph - home_run
Top 10
Miguel Vargas - 71 PA, 0.274 wOBA, 0.378 xwOBA, 0.104 Diff
Steven Kwan - 57 PA, 0.24 wOBA, 0.332 xwOBA, 0.092 Diff
Julio Rodriguez - 74 PA, 0.286 wOBA, 0.37 xwOBA, 0.084 Diff
Nico Hoerner - 70 PA, 0.208 wOBA, 0.29 xwOBA, 0.082 Diff
Dylan Crews - 72 PA, 0.284 wOBA, 0.364 xwOBA, 0.08 Diff
Salvador Perez - 72 PA, 0.222 wOBA, 0.279 xwOBA, 0.057 Diff
Jackson Holliday - 59 PA, 0.275 wOBA, 0.322 xwOBA, 0.047 Diff
Mike Trout - 62 PA, 0.317 wOBA, 0.362 xwOBA, 0.045 Diff
Joc Pederson - 61 PA, 0.288 wOBA, 0.333 xwOBA, 0.045 Diff
Samuel Basallo - 63 PA, 0.235 wOBA, 0.275 xwOBA, 0.04 Diff
Bottom 10
T.J. Rumfield - 77 PA, 0.4 wOBA, 0.246 xwOBA, -0.154 Diff
Pete Crow-Armstrong - 79 PA, 0.589 wOBA, 0.436 xwOBA, -0.153 Diff
Zack Gelof - 77 PA, 0.455 wOBA, 0.307 xwOBA, -0.148 Diff
Paul Goldschmidt - 76 PA, 0.419 wOBA, 0.288 xwOBA, -0.131 Diff
Willson Contreras - 76 PA, 0.413 wOBA, 0.288 xwOBA, -0.125 Diff
Tyler Soderstrom - 78 PA, 0.449 wOBA, 0.351 xwOBA, -0.098 Diff
Nathan Lukes - 70 PA, 0.343 wOBA, 0.247 xwOBA, -0.096 Diff
Jake Mangum - 58 PA, 0.372 wOBA, 0.279 xwOBA, -0.093 Diff
Matt Olson - 67 PA, 0.375 wOBA, 0.285 xwOBA, -0.09 Diff
Wyatt Langford - 70 PA, 0.406 wOBA, 0.317 xwOBA, -0.089 Diff
Pete Crow-Armstrong: 34.0 PA, +0.158 xwOBA OE
Shohei Ohtani: 30.0 PA, +0.155 xwOBA OE
Jac Caglianone: 40.0 PA, +0.136 xwOBA OE
William Contreras: 36.0 PA, +0.133 xwOBA OE
Josh Bell: 34.0 PA, +0.132 xwOBA OE
Bryan Reynolds: 33.0 PA, +0.128 xwOBA OE
Kyle Schwarber: 40.0 PA, +0.126 xwOBA OE
Byron Buxton: 41.0 PA, +0.109 xwOBA OE
Trevor Larnach: 31.0 PA, +0.107 xwOBA OE
James Wood: 40.0 PA, +0.102 xwOBA OE
Anthony Volpe: 31.0 PA, +0.098 xwOBA OE
Travis Bazzana: 34.0 PA, +0.093 xwOBA OE
Juan Soto: 35.0 PA, +0.087 xwOBA OE
Carter Jensen: 36.0 PA, +0.087 xwOBA OE
Kyle Stowers: 33.0 PA, +0.086 xwOBA OE
Eugenio Suarez: 30.0 PA, -0.191 xwOBA OE
Rhys Hoskins: 31.0 PA, -0.171 xwOBA OE
Chandler Simpson: 32.0 PA, -0.152 xwOBA OE
Chase Meidroth: 34.0 PA, -0.151 xwOBA OE
Spencer Steer: 32.0 PA, -0.133 xwOBA OE
Nathan Lukes: 30.0 PA, -0.132 xwOBA OE
T.J. Rumfield: 38.0 PA, -0.129 xwOBA OE
Daylen Lile: 35.0 PA, -0.126 xwOBA OE
Xavier Edwards: 32.0 PA, -0.118 xwOBA OE
Marcelo Mayer: 29.0 PA, -0.117 xwOBA OE
Leody Taveras: 35.0 PA, -0.11 xwOBA OE
Braden Montgomery: 32.0 PA, -0.102 xwOBA OE
Brandon Marsh: 38.0 PA, -0.1 xwOBA OE
Matt Olson: 28.0 PA, -0.097 xwOBA OE
Brandon Lowe: 38.0 PA, -0.097 xwOBA OE
Matt McLain - 60 PA, 30 BIP, 7 Brls, 23.3 Brl%
Shohei Ohtani - 68 PA, 40 BIP, 9 Brls, 22.5 Brl%
Byron Buxton - 72 PA, 52 BIP, 11 Brls, 21.2 Brl%
Mike Trout - 62 PA, 34 BIP, 7 Brls, 20.6 Brl%
Zach Neto - 79 PA, 39 BIP, 8 Brls, 20.5 Brl%
Hunter Goodman - 74 PA, 46 BIP, 9 Brls, 19.6 Brl%
James Wood - 80 PA, 46 BIP, 9 Brls, 19.6 Brl%
Kyle Stowers - 73 PA, 38 BIP, 7 Brls, 18.4 Brl%
Nick Kurtz - 86 PA, 44 BIP, 8 Brls, 18.2 Brl%
Jazz Chisholm - 72 PA, 39 BIP, 7 Brls, 17.9 Brl%
Shohei Ohtani - 68 PA, 0.493 xwOBA
Jac Caglianone - 76 PA, 0.469 xwOBA
Yordan Alvarez - 79 PA, 0.449 xwOBA
Byron Buxton - 72 PA, 0.445 xwOBA
Alec Burleson - 83 PA, 0.445 xwOBA
Pete Crow-Armstrong - 79 PA, 0.436 xwOBA
Dominic Canzone - 59 PA, 0.435 xwOBA
Juan Soto - 72 PA, 0.424 xwOBA
Joe Mack - 52 PA, 0.421 xwOBA
James Wood - 80 PA, 0.415 xwOBA
Steven Kwan - 57 PA, 81 Swings, 92.6 Cont%
Luis Arraez - 77 PA, 150 Swings, 90.7 Cont%
Jung Hoo Lee - 65 PA, 114 Swings, 90.4 Cont%
JJ Wetherholt - 67 PA, 94 Swings, 89.4 Cont%
Nico Hoerner - 70 PA, 125 Swings, 88.8 Cont%
Sal Frelick - 54 PA, 91 Swings, 87.9 Cont%
Mauricio Dubon - 64 PA, 140 Swings, 87.9 Cont%
Lane Thomas - 67 PA, 114 Swings, 87.7 Cont%
Isaac Collins - 69 PA, 103 Swings, 87.4 Cont%
Javier Sanoja - 52 PA, 100 Swings, 87.0 Cont%
Esteury Ruiz - 5 Attempts (3 steals)
Jazz Chisholm Jr. - 5 Attempts (5 steals)
Jackson Merrill - 5 Attempts (5 steals)
Nasim Nunez - 4 Attempts (4 steals)
Geraldo Perdomo - 4 Attempts (2 steals)
Bobby Witt Jr. - 4 Attempts (4 steals)
Henry Bolte - 4 Attempts (3 steals)
Jose Caballero - 3 Attempts (2 steals)
Blake Dunn - 3 Attempts (1 steals)
Andres Gimenez - 3 Attempts (3 steals)
Jared Triolo - 3 Attempts (3 steals)
Caleb Durbin - 3 Attempts (2 steals)
Jasson Dominguez - 3 Attempts (3 steals)
David Hamilton - 3 Attempts (2 steals)
Dansby Swanson - 3 Attempts (3 steals)
Otto Lopez - 3 Attempts (3 steals)
Pete Crow-Armstrong - 3 Attempts (3 steals)
Cooper Pratt - 3 Attempts (3 steals)
Travis Bazzana - 3 Attempts (2 steals)
George Springer - 3 Attempts (3 steals)
Bobby Witt Jr. - 13 Attempts (12 steals)
Jazz Chisholm Jr. - 12 Attempts (11 steals)
Jake Mangum - 11 Attempts (8 steals)
Ronald Acuna Jr. - 11 Attempts (8 steals)
Esteury Ruiz - 9 Attempts (6 steals)
Jakob Marsee - 9 Attempts (5 steals)
David Hamilton - 8 Attempts (6 steals)
Fernando Tatis Jr. - 8 Attempts (6 steals)
Nasim Nunez - 8 Attempts (7 steals)
Otto Lopez - 8 Attempts (8 steals)
Ceddanne Rafaela - 7 Attempts (5 steals)
Cody Bellinger - 7 Attempts (5 steals)
Jeremy Pena - 7 Attempts (6 steals)
Blake Dunn - 7 Attempts (4 steals)
Leody Taveras - 7 Attempts (6 steals)
Randy Arozarena - 7 Attempts (5 steals)
Pete Crow-Armstrong - 7 Attempts (6 steals)
Travis Bazzana - 7 Attempts (5 steals)
Trea Turner - 7 Attempts (6 steals)
Dominic Canzone - 59 PA, 11.9 K%, 15.2 Brl%
Royce Lewis - 65 PA, 20.0 K%, 17.4 Brl%
Spencer Horwitz - 80 PA, 17.5 K%, 15.1 Brl%
Victor Caratini - 48 PA, 14.6 K%, 14.7 Brl%
Yordan Alvarez - 79 PA, 12.7 K%, 15.3 Brl%
Pete Crow-Armstrong - 122 PA, +0.128 xwOBA
Jac Caglianone - 112 PA, +0.098 xwOBA
Colton Cowser - 93 PA, +0.076 xwOBA
James Wood - 120 PA, +0.075 xwOBA
Mauricio Dubon - 93 PA, +0.072 xwOBA
Bryan Reynolds - 116 PA, +0.07 xwOBA
Kyle Karros - 85 PA, +0.069 xwOBA
Lane Thomas - 89 PA, +0.061 xwOBA
Isiah Kiner-Falefa - 80 PA, +0.058 xwOBA
Dominic Canzone - 82 PA, +0.058 xwOBA
Matt McLain - 81 PA, +11.5 Brl%
Kyle Karros - 85 PA, +8.1 Brl%
Hunter Goodman - 110 PA, +8.1 Brl%
Spencer Horwitz - 121 PA, +7.7 Brl%
Curtis Mead - 98 PA, +7.2 Brl%
Jackson Holliday - 90 PA, +7.0 Brl%
Yordan Alvarez - 114 PA, +6.6 Brl%
Bryan Reynolds - 116 PA, +5.9 Brl%
Mauricio Dubon - 93 PA, +4.3 Brl%
Brandon Nimmo - 115 PA, +4.3 Brl%
Lane Thomas - 89 PA, +13.5 Cont%
Cole Young - 113 PA, +9.9 Cont%
JJ Wetherholt - 107 PA, +9.7 Cont%
Carter Jensen - 106 PA, +9.2 Cont%
Josh Naylor - 103 PA, +9.1 Cont%
Zack Gelof - 111 PA, +8.3 Cont%
Troy Johnston - 99 PA, +7.5 Cont%
Tyler Soderstrom - 110 PA, +7.4 Cont%
Ozzie Albies - 102 PA, +6.5 Cont%
Colton Cowser - 93 PA, +5.8 Cont%
Colton Cowser - 93 PA, -12.6 K%
Troy Johnston - 99 PA, -11.8 K%
Cole Young - 113 PA, -9.4 K%
Juan Soto - 101 PA, -9.0 K%
Kyle Karros - 85 PA, -8.7 K%
Tyler Soderstrom - 110 PA, -8.6 K%
JJ Wetherholt - 107 PA, -8.0 K%
Lane Thomas - 89 PA, -7.7 K%
Brooks Lee - 118 PA, -7.7 K%
Bryan Reynolds - 116 PA, -7.5 K%
Sal Stewart: +3.22
Ketel Marte: +3.1
Logan O’Hoppe: +2.7
Garrett Mitchell: +2.22
Travis Bazzana: +2.15
Marcelo Mayer: -2.67
Vaughn Grissom: -2.55
Jonathan Aranda: -2.43
Chase Meidroth: -1.9
Bo Bichette: -1.8
Michael Busch - 0.423 xwOBA, 12.5% Brl%, 80.3% Contact%, 19.8% Chase%, 14.0% K%
William Contreras - 0.421 xwOBA, 10.0% Brl%, 84.3% Contact%, 24.3% Chase%, 11.5% K%
Coby Mayo - 39.7% Whiff%, 70.6% Weak%, 0.923 Cold Rating
Brett Baty - 31.6% Whiff%, 82.4% Weak%, 0.913 Cold Rating
Daniel Schneemann - 42.2% Whiff%, 68.8% Weak%, 0.908 Cold Rating
Jake Bauers - 34.5% Whiff%, 70.6% Weak%, 0.882 Cold Rating
Oswald Peraza - 31.8% Whiff%, 70.8% Weak%, 0.856 Cold Rating
Austin Riley - 40.0% Whiff%, 65.2% Weak%, 0.853 Cold Rating
Wade Meckler - 31.1% Whiff%, 70.8% Weak%, 0.849 Cold Rating
Marcelo Mayer - 28.6% Whiff%, 73.9% Weak%, 0.838 Cold Rating
Dansby Swanson - 27.1% Whiff%, 80.0% Weak%, 0.829 Cold Rating
Tommy Troy - 28.6% Whiff%, 72.0% Weak%, 0.823 Cold Rating
Danny Serretti (AAA - ARI) 228 PA 1.026 OPS
Sean Keys (AAA - TOR) 270 PA 1.006 OPS
Manuel Pena (AAA - ARI) 299 PA 1.006 OPS
Owen Ayers (AA - CHC) 203 PA 1.004 OPS
James Tibbs III (AAA - LAD) 335 PA 1.0 OPS
Drew Cavanaugh (AAA - SF) 219 PA 0.995 OPS
Cooper Ingle (AAA - CLE) 211 PA 0.987 OPS
Ben Ross (AAA - MIN) 277 PA 0.985 OPS
Josue De Paula (AA - LAD) 309 PA 0.978 OPS
Zac Veen (AAA - COL) 286 PA 0.978 OPS
Franklin Arias (AA - BOS) 248 PA 0.974 OPS
Jace Avina (AA - NYY) 236 PA 0.971 OPS
Joshua Baez (AAA - STL) 303 PA 0.969 OPS
Jack Suwinski (AAA - LAD) 293 PA 0.965 OPS
David McCabe (AA - ATL) 220 PA 0.962 OPS
Felix Reyes (AAA - PHI) 212 PA 0.96 OPS
Yohandy Morales (AAA - WSH) 281 PA 0.951 OPS
Pablo Reyes (AAA - SD) 231 PA 0.944 OPS
Raudi Rodriguez (AA - LAA) 274 PA 0.943 OPS
Oliver Dunn (AAA - TB) 231 PA 0.938 OPS
Kade Anderson (AA - SEA) 61 IP 37.4% K-BB
Brandon White - 681449 (AAA - MIA) 57 IP 25.1% K-BB
Joe Whitman (AAA - SF) 66 IP 25.0% K-BB
Ryan Sloan (AA - SEA) 51 IP 23.6% K-BB
Carlos Pena (AA - DET) 51 IP 23.5% K-BB
Karson Milbrandt (AAA - MIA) 62 IP 23.5% K-BB
Jackson Kent (AAA - WSH) 58 IP 23.4% K-BB
Adam Seminaris (AA - PHI) 70 IP 23.0% K-BB
Cesar Perdomo (AA - SF) 61 IP 22.5% K-BB
Gage Ziehl (AA - BOS) 53 IP 22.1% K-BB
Matt Wilkinson (AAA - SF) 53 IP 21.6% K-BB
Daniel Eagen (AA - ARI) 55 IP 21.2% K-BB
Shinnosuke Ogasawara (AA - WSH) 58 IP 20.5% K-BB
Grant Kipp (AA - CHC) 51 IP 20.5% K-BB
Tyson Hardin (AAA - MIL) 69 IP 20.4% K-BB
Bruce Zimmermann (AAA - STL) 67 IP 20.3% K-BB
Manuel Rodriguez - 804973 (AA - MIL) 63 IP 20.1% K-BB
Mason Molina (AA - STL) 62 IP 20.0% K-BB
Carlos Lagrange (AAA - NYY) 61 IP 18.4% K-BB
Brendan Beck (AAA - NYY) 81 IP 18.4% K-BB
Sean Burke (31.0% Owned): Projected 5.73IP 2.3ER 5.74SO 2.31BB 16.77FPts
Sean Sullivan (1.0% Owned): Projected 5.34IP 2.4ER 5.46SO 1.32BB 15.28FPts
Brandon Sproat (13.0% Owned): Projected 5.2IP 2.48ER 5.59SO 2.61BB 14.89FPts
Donovan Walton - 27 PA, 1.407 OPS
Nasim Nunez - 32 PA, 1.241 OPS
Trevor Larnach - 31 PA, 1.234 OPS
Josh Bell - 34 PA, 1.19 OPS
Blaze Alexander - 28 PA, 1.131 OPS
Anthony Volpe - 31 PA, 1.125 OPS
Caleb Durbin - 30 PA, 1.079 OPS
Nathan Church - 27 PA, 1.064 OPS
Jake McCarthy - 31 PA, 0.987 OPS
Nick Loftin - 29 PA, 0.956 OPS
J.P. Crawford SS (3.0% Owned): Projected 0.89R 0.14HR 0.64RBI 0.87SO 0.64BB 0.06SB 9.51FPts
Nelson Velazquez RF (1.0% Owned): Projected 0.69R 0.25HR 0.78RBI 0.93SO 0.43BB 0.06SB 9.23FPts
A.J. Ewing 2B (40.0% Owned): Projected 0.66R 0.13HR 0.72RBI 1.14SO 0.59BB 0.3SB 9.1FPts
Jake McCarthy LF (27.0% Owned): Projected 0.75R 0.14HR 0.55RBI 0.78SO 0.22BB 0.2SB 9.02FPts
Spencer Horwitz 1B (48.0% Owned): Projected 0.76R 0.18HR 0.56RBI 0.77SO 0.47BB 0.02SB 8.96FPts
Austin Martin SS (7.0% Owned): Projected 0.77R 0.1HR 0.56RBI 0.76SO 0.4BB 0.15SB 8.93FPts
Jasson Dominguez CF (37.0% Owned): Projected 0.67R 0.13HR 0.61RBI 1.26SO 0.41BB 0.22SB 8.79FPts
Pavin Smith RF (1.0% Owned): Projected 0.66R 0.18HR 0.71RBI 0.93SO 0.6BB 0.05SB 8.7FPts
Jared Young 1B (4.0% Owned): Projected 0.67R 0.21HR 0.8RBI 1.1SO 0.46BB 0.05SB 8.7FPts
Luke Raley LF (39.0% Owned): Projected 0.67R 0.21HR 0.68RBI 1.18SO 0.3BB 0.04SB 8.48FPts