

DraftKings offers this new market this year called HITS + ER + BB where you can bet on a pitcher’s performance in those three categories summed up.
I wanted to tune my projections to it and see where the biggest differences lie, so I’ve done that.
It turns out that DraftKings just takes their O/U numbers from hits, earned runs, and walks and then sums them together to put the line on this H+BB+ER. Makes sense, I guess! But the prices dictate the actual implication.
So I’ve scraped those lines (the prices won’t be exactly right because I do have to estimate them based on the prices on the other markets - this market data isn’t fully available in the API I use) and then I merge in my projection for each guy, find the difference, check the price, and then assign an EV and a Bet Grade for each.
There are three A+ grades right out of the gate, which I guess isn’t a great sign. I have no proof that this works, it’s brand new. But it will at least give you an idea of where the projections lean.
Let’s take an example for today:

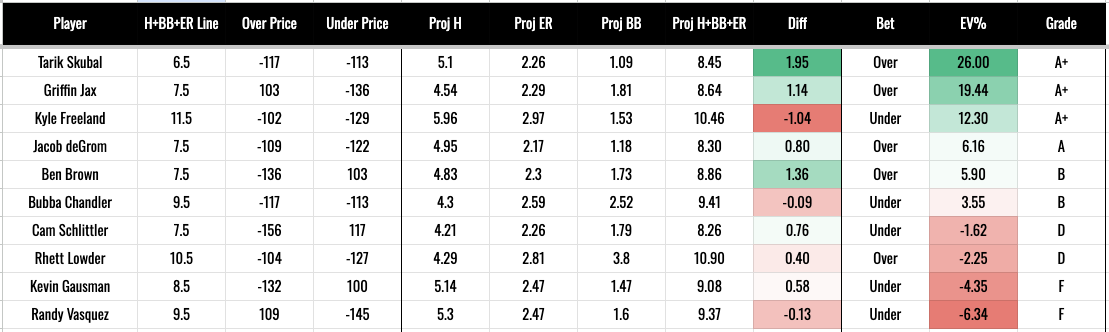
Skubal’s OVER 6.5 H+ER+BB is 6.5 for -123. My projection on Skubal:
5.1 hits
2.3 earned runs
1.01 walks
That sums to 8.45 H+BB+ER, and towers above the 6.5 line for a price pretty close to even. So if this is working well, you’d bet the OVER and expect to win like 75% of the time or something like that.
The tab has been added to the Google Sheet “MLB DW Daily Matchups Cheat Sheet”. Check the “H+ER+BB” tab; it will get updated throughout the day as the lines come out and the projections do their thing.
You do not have to be a PRO MEMBER for this. The Google Sheet is for all standard paid subs.
If someone wants to do some tracking over the next month or two and keep me updated on it, I’d welcome that.