
Quantifying Pitcher Effort Level
Looking into some fastball velo distributions to find which pitchers are pushing more than others to get to high velo

John Laghezza inspired this one, so check him out. Sharp dude in the betting space, among other things.
You can take this one in two ways. You can either read it below, or listen to it on the podcast feed. I covered most of the same stuff on a podcast episode, and probably did a more complete explanation since it’s easier to talk than to type.
We’re going for practical advice here. So let’s define our goal and our theory in helping us get to the goal.
The Goal
To more accurately predict which starting pitchers will stay healthy.
A tough goal to accomplish! You might even say an impossible one. But there’s a gradient here. The best person in the world at predicting injuries will still miss a ton of the predictions, but he’ll do a better job than a random number generator. Maybe not a ton better, but better for sure!
And the reason we want to achieve that goal is obvious. One great way to immediately derail your fantasy teams in a given year is to draft an SP who pops his elbow in April, heading to the IL to not be seen again for 15 months.
The Theory
The theory is that there’s a positive correlation between the rate in which you’re exerting max effort and your chances of sustaining an arm or shoulder injury.
I’m not taking credit for the theory, not at all! There have been actual doctors and researchers doing that for us. Michael Salfino wrote this up in 2023, you can read that at The Athletic here.
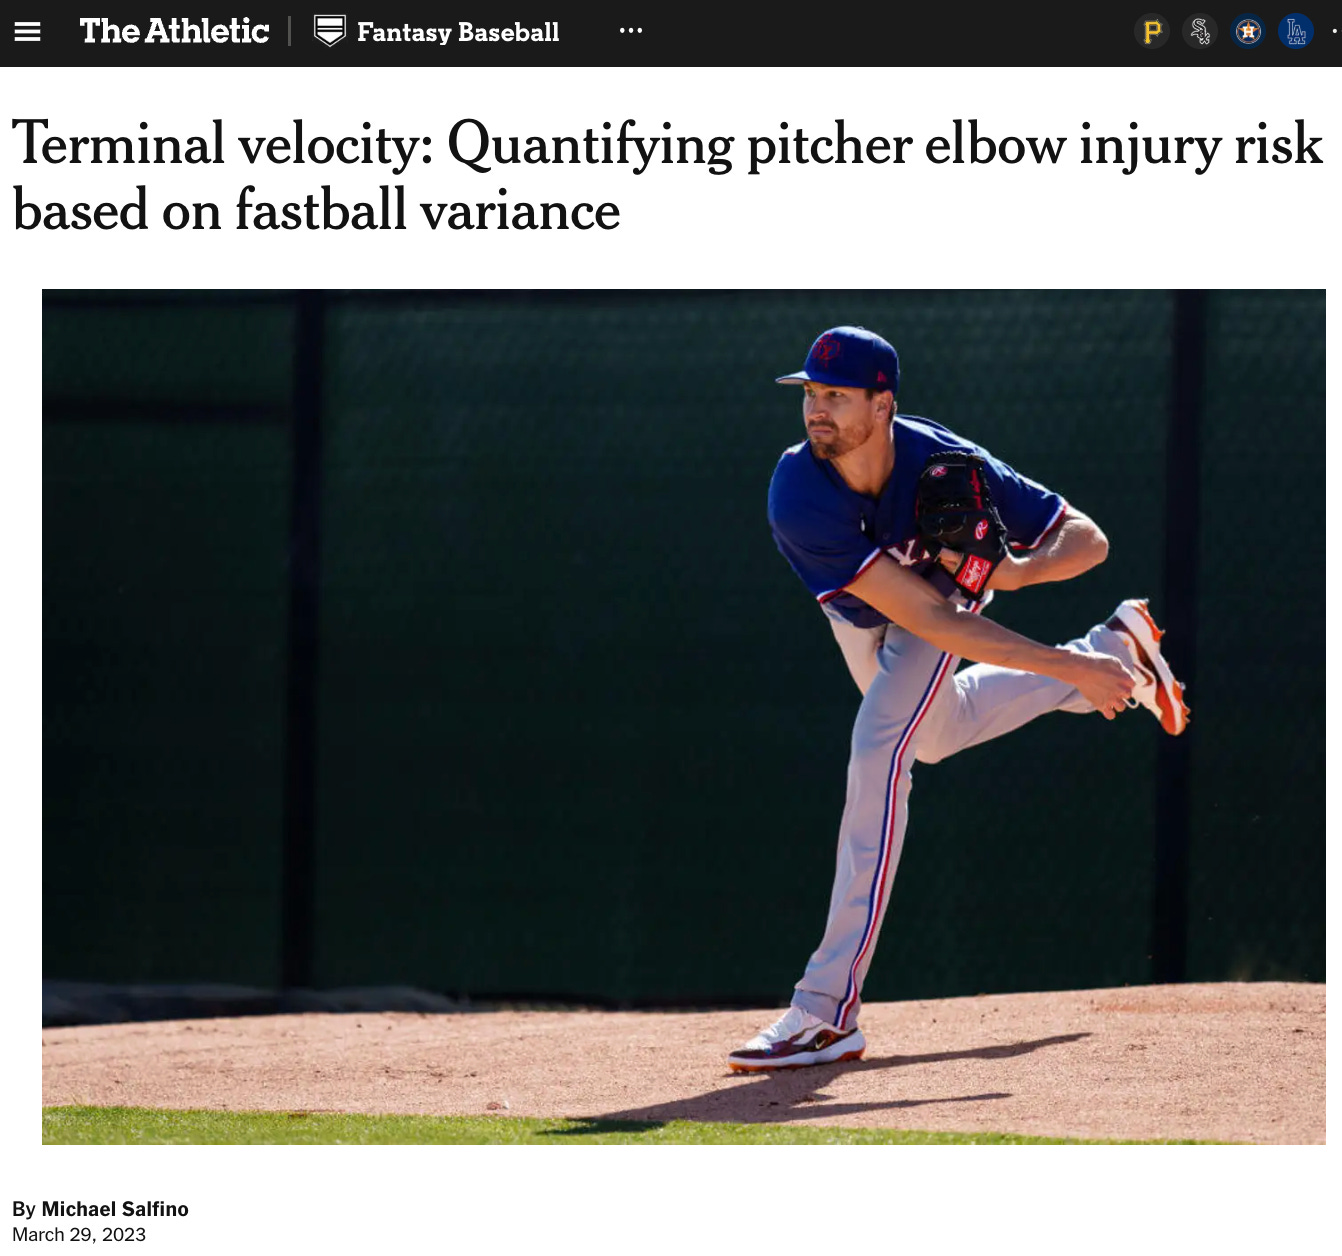
The bottom line is this: it seems like pitchers who more frequently throw near their max velocity are more at risk of injury.
We can measure this quite easily, since we have access to the pitch-by-pitch data set. So I retrieved the data for each of the last four seasons. I went back to 2022 to look at the biggest standouts on either side to see if there’s any visible signal. And there wasn’t, but there’s only so much you can do with the human eye. One year of data wouldn’t tell you anything, anyway. But enough research has already been done (spoken about in that article) that I don’t really feel I need to weigh in on the legitimacy of this. They’ve already studied it in a better and more patient way than I could.
So if you doubt this whole idea, I’m pleading innocence here. But if you’re buying even a little bit of what those other guys are selling, I’m here to give you the data on which guys to feel good or bad about right now.
And even in that article, obviously, there’s an admission that this is not an exact science. There are all kinds of reasons that a professional thrower of an object could get their arm hurt. The best we can say about all of this is that it pushes us a little bit closer to accuracy. Nobody should be claiming we know for sure if somebody is super high risk or super low risk.
I hope that’s enough qualifiers for you! Let’s look at last year. The data I have, and that I will give out to paid subs, has all of this:
Pitcher
Pitch Type
Pitch Count
Max Velo
90th percentile velo
50th percentile velo (average)
10th percentile velo
Difference between max and average
Difference between 90th and average
2026 ADP
We will look at the smallest and largest gaps in 90th minus average. Max gives you one data point, and I don’t trust the radar guns not to screw up once per year. So I don’t like looking at max anything much. Let’s sort by the difference between the average and the 90th percentile.
We have to set expectations here, so let’s give the two extremes off the bat to get an idea of what is a big gap and what is a small gap.
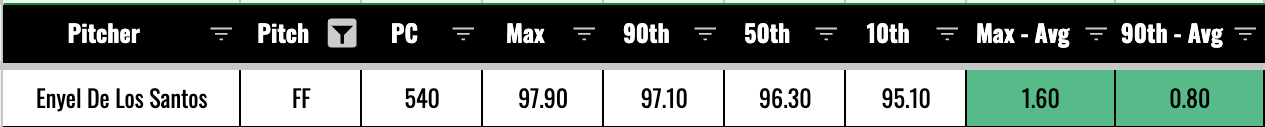
The smallest gap belonged to Enyel De Los Santos. His 90th percentile fastball velo was 97.1. That was just 0.8mph above his average of 96.3.
The largest gap goes to Chris Sale. He averaged 95.0mph, reached as high at 99.4mph, and the 90th percentile came in at 97.0mph. So he was really spreading it out, and probably taking it pretty easy with most of his fastballs.

So it’s a small range. 1.2mph separates the two there.
Possibly More Risky
That’s as forceful as I can be, “possibly more risky”. Which is like saying “possibly maybe” or something. I’ve filtered this to everybody under a gap of 1.2, and then I’ve hidden the relievers and the pitchers not being drafted in the top 450 this year.
Here are your results:
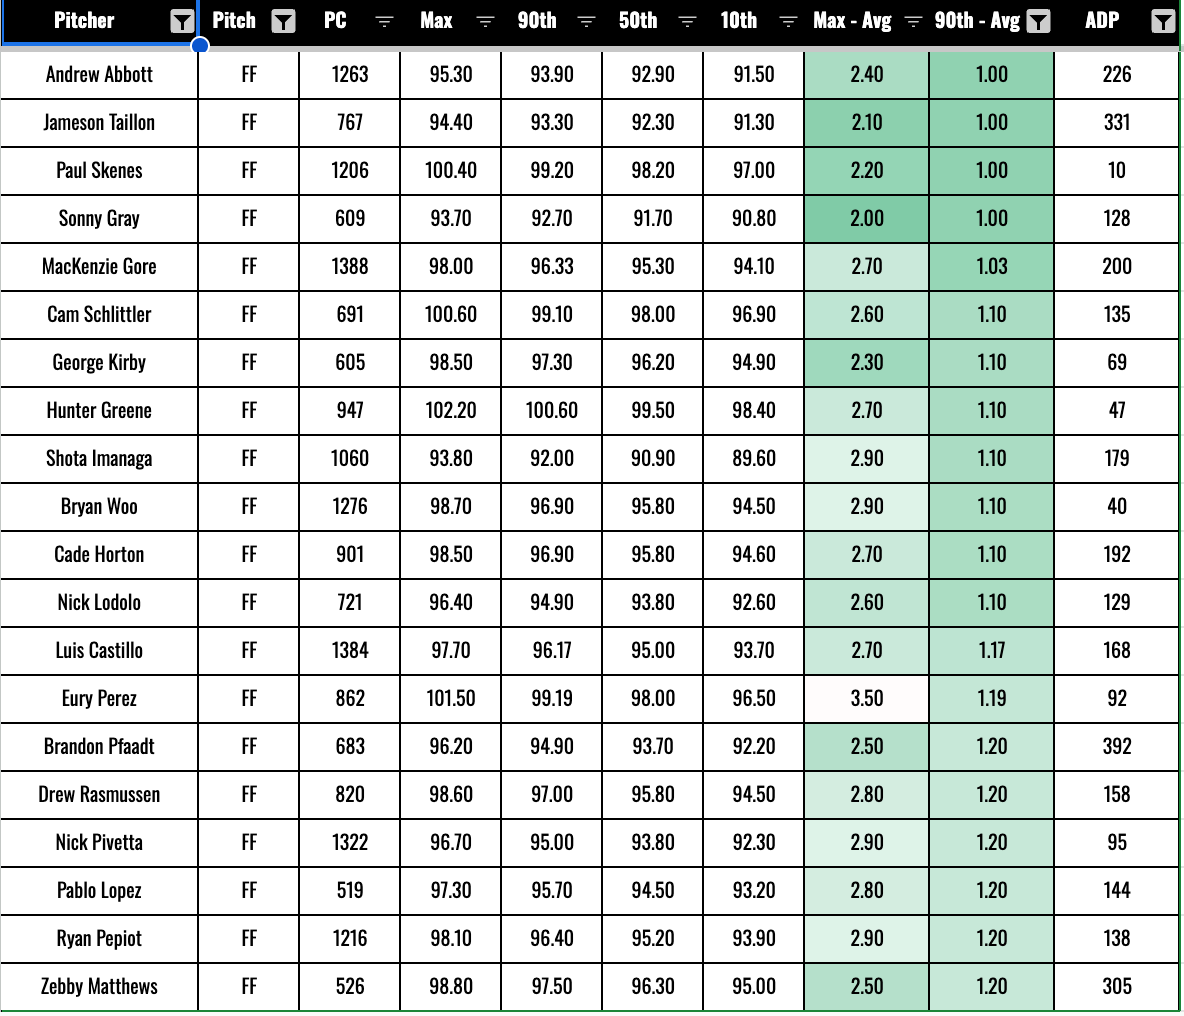
Andrew Abbott, Jameson Taillon and Paul Skenes! Oh boy, we don’t like to see the Skenesinator popping up here. His max effort is around 100.4mph, and his average was just a bit below that at 98.2.
ONE CAVEAT! Is that really his max? Because his max in 2024 was 101.9. So we might simply not have seen his max in 2025. And that would ease the risk here, because that means he wasn’t reaching for the max at all in 2025. But it’s not like the dude’s max is actually 105. If you’re invested in Paul Skenes in any way, I’m sure you’ve been bothered by this in the past, even before knowing this particular data point. How many 98+mph heaters can the dude uncork before he has some trouble? Elbow surgery almost feels inevitable with these guys. And this isn’t great news, we can at least say that!
As for Abbott, he’s not throwing hard overall. The average is under 93, the max is under 95.5. But does that matter? For the theory we’re working with, I don’t think it does. Max effort is max effort no matter what. If I went out and threw 500 baseballs as hard as I could, I’d only be reaching like 65mph, but I’d still probably mess my arm up. And Abbott was reaching close to his max quite often.
Sonny Gray is another name of interest. The Red Sox are counting on him. The thing with Gray, though, is that he’s been doing this every year. There’s a tab in the data for each year, and he’s near the top of the list when sorted this way each time. And he hasn’t been hurt. So that helps his case for 2026.
I’ll leave the rest to you, my commentary isn’t adding much. I’m a bit George Kirby guy, but seeing him here does make me feel uneasy about the shares I have and the shares I intend to keep adding on. He’s throwing hard a lot, and we didn’t see a clean bill of health with him last year.
Let’s go to some good news now.
The Safer Options?
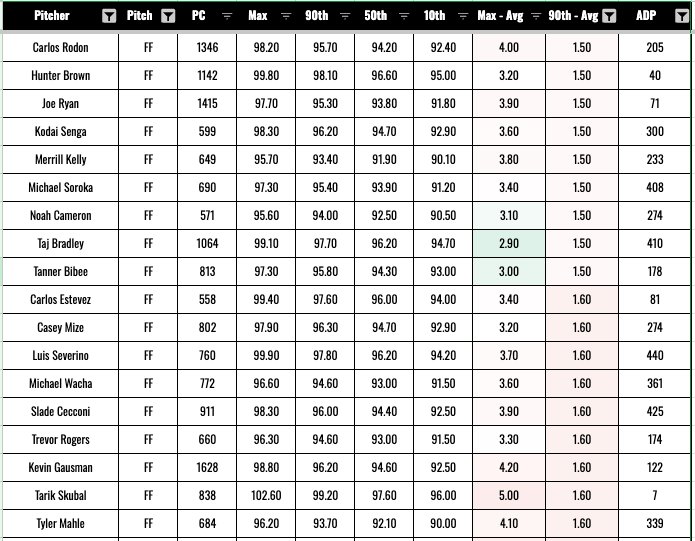
Here are your fantasy-relevant SPs for 2026 with the biggest gaps between their top-level velo and their average. And right off the bat, we see Carlos Rodon, who is currently recovering from elbow surgery. Just in case you needed another reason not blindly trust this stuff.
But to be fair, there are some ironmen on this list as well. We’ve seen plenty of bulk from Hunter Brown, Joe Ryan, Merrill Kelly, Noah Cameron, and Tanner Bibee. That’s a bit selective, but it’s true! I’ve given everybody a lot of reasons to avoid Hunter Brown this year, but here’s a reason to not avoid him.
Sorted by ADP
Maybe a better way to do this is just to look at the most expensive SPs and see how they compare with each other. Injury risk is most important in the early rounds when you’re taking players who you cannot replace on waivers. If you take a shot at Shane McClanahan at ADP 200 this year and he gets hurt again, you’ll be able to recover from that. But losing a Skenes is a different story.
Top 50 in ADP
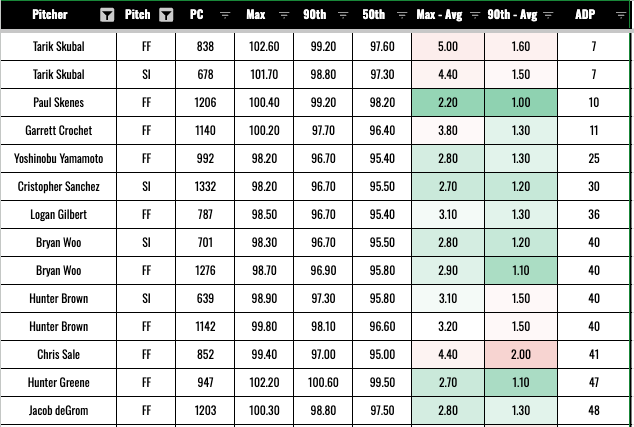
It’s a striking difference between Skubal and Skenes. Their 90th percentile makrs on the four-seamer are both the same - 99.2. But Skubal averages 97.6, while Skenes averages 98.2. So Skenes plays around max exertion a lot more than Skubal.
Crochet, the other member of the big three in 2026, falls in between them with a 1.3mph gap between the 90th and 50th.
So Skubal, Brown, and Sale would be the safest bets of these names, while Skenes, Woo, and Hunter Greene would be deemed riskier.
ADP 50-100:
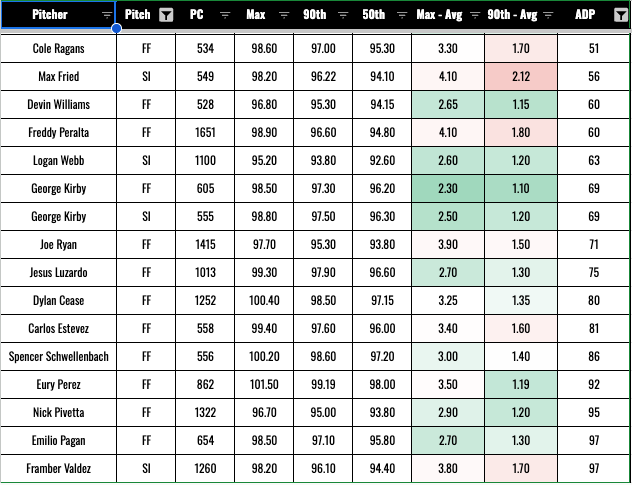
It’s a touch bothersome to see Eury Perez with one of the smaller gaps. He’s averaging 98 while topping out at 101.5 and going for a 99.2 90th. But hey he already had that TJ two years ago, so he’s in the honeymoon period, right? … Right??
Logan Webb eases the tensions overall. He hits his top range at a higher rate, but that dude throws ten innings before putting milk in his cereal every morning.
That’s all I have to say. Check out the podcast version for more talk on it. I thought this was more than interesting enough to write about, but I don’t feel like I did the best job doing it. Some articles feel a lot better than others. But I’ll give you the data, so you have something to take with you.