Stats You Should Know
Some Surprising Hitter Stats from the Early Weeks of 2026


Angels Strikeout Improvements
The Angels had a league-topping strikeout rate of 27% last year. This year, it’s still worse-than-average, but it’s down a couple of points to 25%. And that’s mostly due to this trio of hitters:
Mike Trout: 33% → 21%
Jo Adell: 26% → 17%
Logan O’Hoppe: 31% → 18%
All of those guys have huge raw power, and the power guys are always the ones we’re most interested in when they lower the strikeout rates.
Mike Trout has turned the clock back. He has a 29.4% Brl% with an 88% Zone-Contact%. Look at his ridiculous placement on the Contact% vs. Barrel% plot:
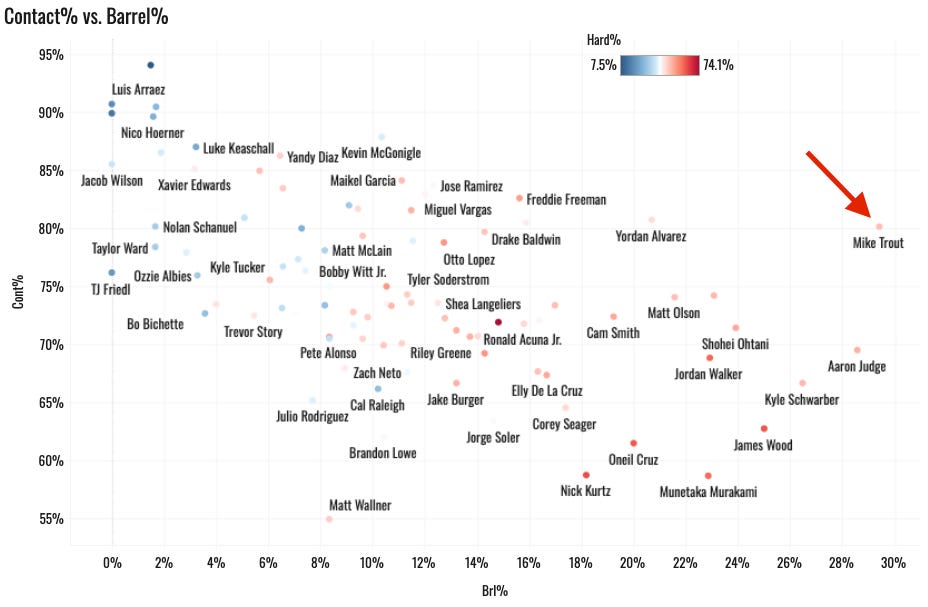
You can do one of two things if you have Trout
Sell high, betting on an injury to happen again
Ride out the elite production while it lasts
Jo Adell has never made contact like this.
2022: 88 G, 38% K%
2023: 17 G, 40% K%
2024: 130 G, 28% K%
2025: 152 G, 26.5% K%
2026: 20 G, 17% K%
We might look up next week and see a 25% K%. If he strikes out in his next plate appearance, the K% will come up a point. So a bad week can change things in a hurry, but it’s alluring to think about what a sub-25% K% Jo Adell might do.
So far, the extra contact has come with a reduced barrel rate (17.3% → 6.1%). But the rest of the launch profile looks mostly the same. He still has an average EV above 90mph, his average launch angle has come up 1.7 degrees, and his fly ball rate is a 35%, a huge number. I would be inclined to think that he’s slowed down the bat to make more contact, but he’s still showing 97th percentile bat speed right now. The stolen base attempt rate is a super low 4%, so those haven’t returned (29% attempt rate in 2024, 5% in 2025), but if he’s going to hit 30+ homers against with a potential .270+ batting average, that’s a stud player. It certainly helps him when Mike Trout is in the lineup around him.
Logan O’Hoppe is hitting .218/.333/.291 with one homer. So the contact gains haven’t helped him, at least not yet. The .193 xBA is very poor. His launch angles have been a mess, but more contact with this guy is a welcome sign. That’s been the main issue in his career.
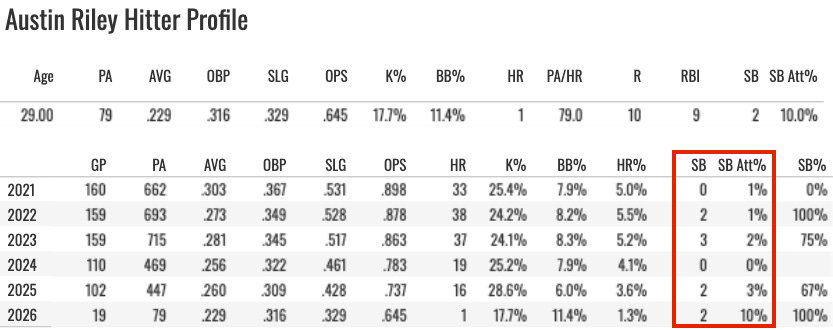
Austin Riley’s Stolen Bases
Two points to make on Austin Riley, but we’ll start with the stolen base thing. He’s already swiped two bags, which is one short of his career high. His attempt rate is 10%, and he’s 2/2 on attempts.
And this isn’t out of nowhere, there was some talk in the spring about a new coach maybe encouraging these guys to run a little bit more. And it does seem like Riley is heading for a 5-10 steal season.
But that’s not all! His K% is down to 18%, and his walk rate is up to 11%.
Austin Riley Stats by Year
→ 2023: 24.1% K%, 8.3% BB%
→ 2024: 25.2% K%, 7.9% BB%
→ 2025: 28.6% K%, 6.0% BB%
→ 2026: 17.7% K%, 11.4% BB%
Massive positive movement in both. His .242 xBA is a dozen points above his actual, and he’s at just on ehomer despite a still decent 9% Brl%, 25% FB%, and 13% Air Pull%.
The walk gain is often explained by a lower swing rate, but Riley is right at the league average with a 46% Swing% this year. He’s not being overly passive, he’s making wise swing decisions.
With his .645 OPS, I think it’s a pretty good time to try to buy low on Riley. We still have to expect 25+ homers, and it might just come with a dozen steals to boot this year.