

I’ve done this in the past but haven’t checked up on it awhile. Oftentimes you’ll hear me talk about the difference between SwStr% and K%. One of my most posted scatter plots is the one that compares SwStr% with K%.
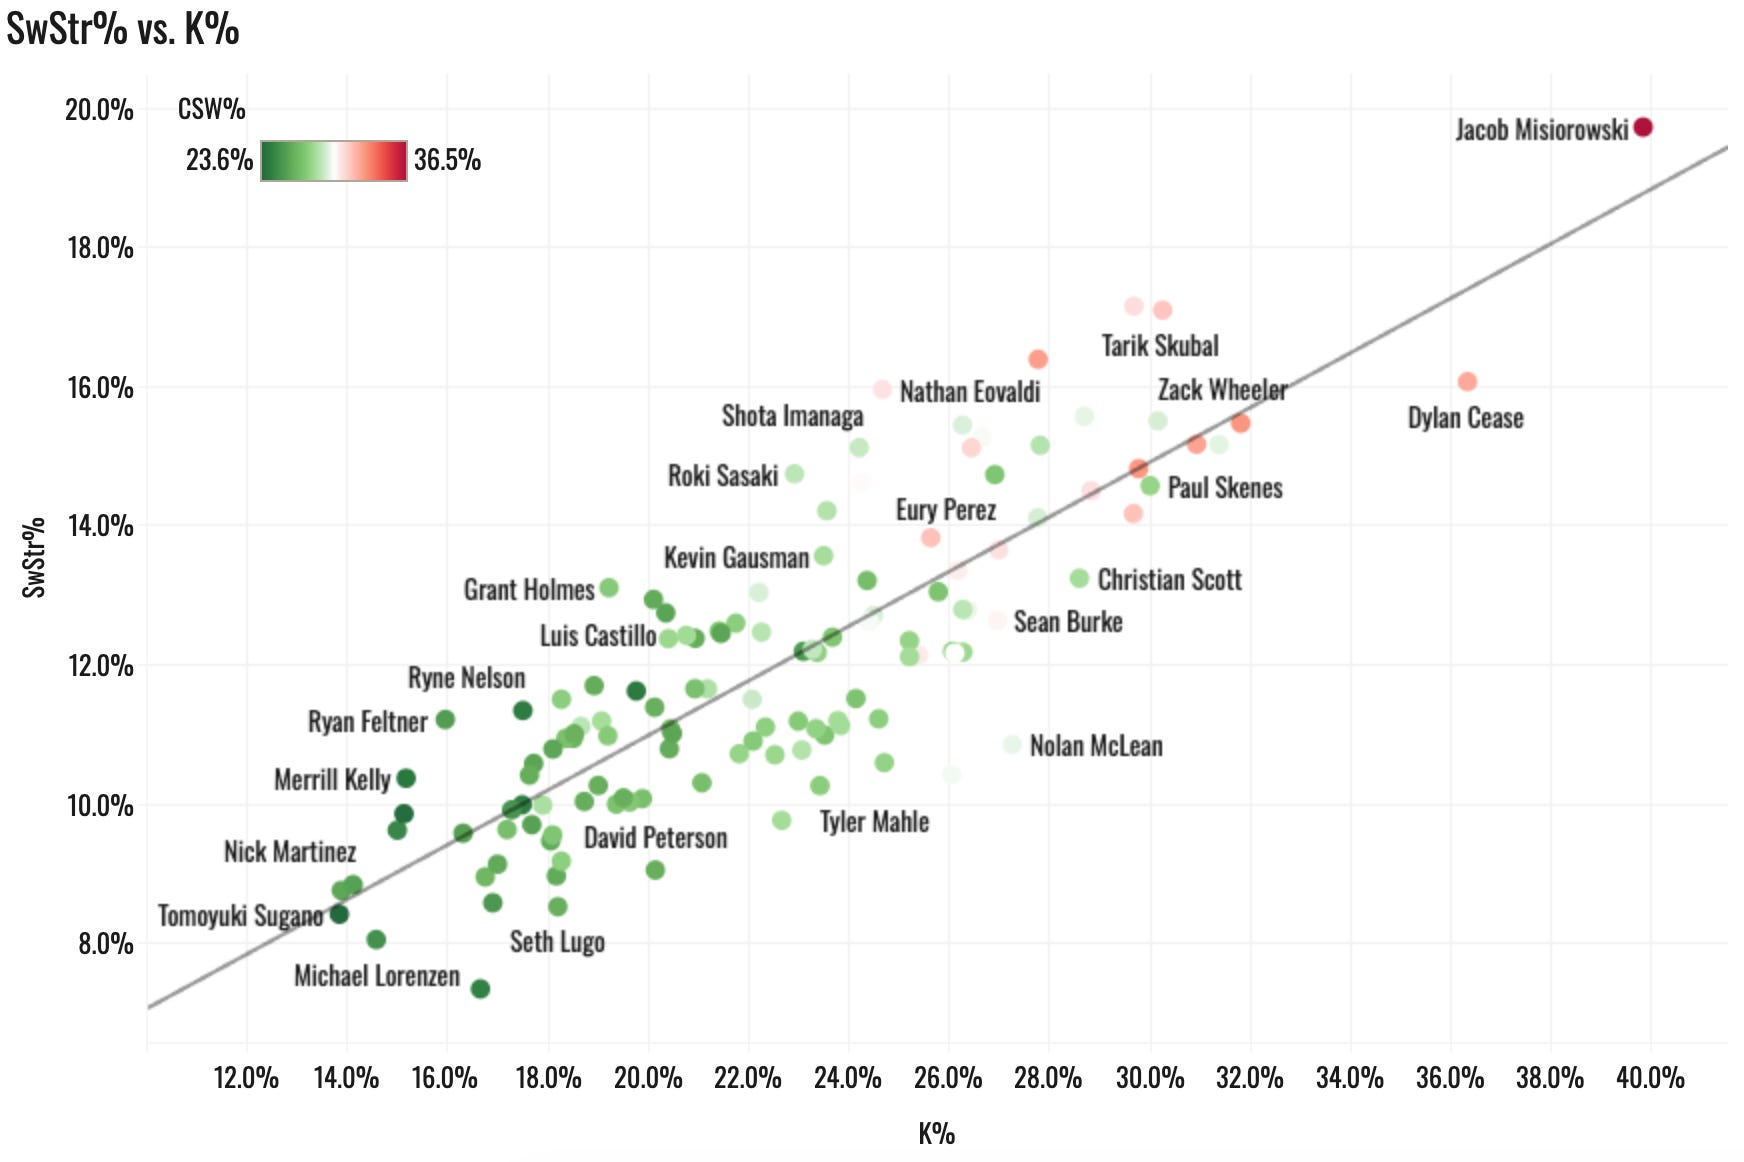
The idea is to weigh SwStr% against K% to get an idea of what direction future K% might go in. This isn’t foolproof. Our example from last season and this season has been Nolan McLean. His 10.8% SwStr% is low, but his 27.3% is high. He’s done this for almost two full seasons now, and when you watch him you kinda figure out how that works. His stuff moves so much that he just gets those frozen hitters more often when they can’t pull the trigger and take a strike that they’d have liked to have swung at.
But generally this is a useful principle. We have seen McLean’s K% slip 2.5 points this year, as we predicted when looking at his 12.1% SwStr% from last year. It’s still not a perfect example, because his SwStr% has dipped this year as well:
McLean 2025: 12.1% SwStr%, 29.9% K%
McLean 2026: 10.8% SwStr%, 27.3% K%
The proportion here is about the same. He’s still outperforming his SwStr% and will probably continue to do so.
But anyway, another way to look at this would be by looking at each pitcher’s ability to get strikes overall versus their ability to get them when there are two strikes. A swing and a miss on a 0-0 count is great, but not as good as a swing and a miss on a 0-2 count. So there will be guys who get their called strikes or whiffs at suboptimal times. That’s what we’re looking for here.
We’ll use CSW% here instead of my version of Strike%, which is featured on the dashboards, because my version of Strike% counts foul balls as strikes, and a foul ball in a two-strike count doesn’t do you any good. It’s a neutral outcome.
We’re comparing CSW% overall with CSW% in two-strike counts and finding the biggest differences. I’m looking only at pitchers with 10+ starts made this year.
LEAGUE AVERAGE CSW% = 27.8%
LG AVERAGE 2-STRIKE CSW% = 24.4%
It drops a bit in two-strike counts because hitters try harder to make contact to avoid the strikeout. Here are your biggest differentials in the direction that would predict more strikeouts coming in the future:
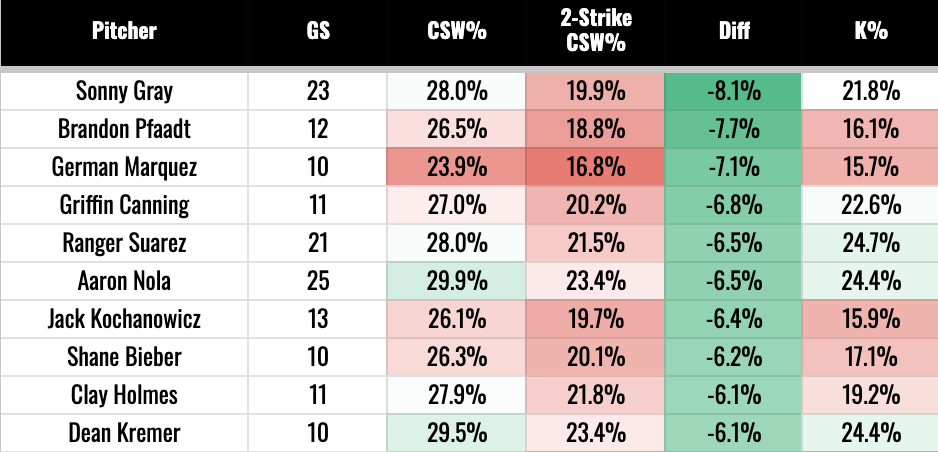
Lots of called strike guys here. Sonny Gray is number one, the guy who has long been able to pile up some strikeouts without getting a ton of swing-and-misses. He has a league-average CSW% overall (28%), but he’s 4.5 points below average in two strike counts. His stuff is pretty easy to get a bat on, but tough to hit hard and he gets a lot of soft contact because of it. But it wouldn’t be a surprise to see Gray raise that K% as things go on. And we could say that just by looking at his past few years anyways:
2024: 30% K%
2025: 27% K%
2026: 22% K%
Brandon Pfaadt is one of the most interesting pitchers going right now. He’s been elite in the box score for a month now. He has a 1.22 ERA in his last seven starts despite a 12.9% K%. What we see here is that he’s a below-average strike-getter all the time, but he really has not been able to do it when it matters the most at just a 19% two-strike CSW%.
Pfaadt has gotten soft contact time in and time out since rejoining the rotation. We’re seeing him hit corners and fool guys, but not enough to generate strikeouts at a good clip. He had a 24% K% in 2024, 19% last year, and now 16% over his last 93 innings this year. So it’s another case where you could just regress him toward his career average and come up with the same conclusion we have here.
Aaron Nola is the third guy I want to point out here. He has an above-average CSW% in all counts at 29.9%. That’s pretty good. In two-strike counts, it’s 23.4%.
Nola’s been prety unlucky this year. His K% is in line with the last three years. He’s walked a few more guys, but his HR/9 has ballooned to 2.1 after going from 1.4 in 2024 to 1.7 in 2025.
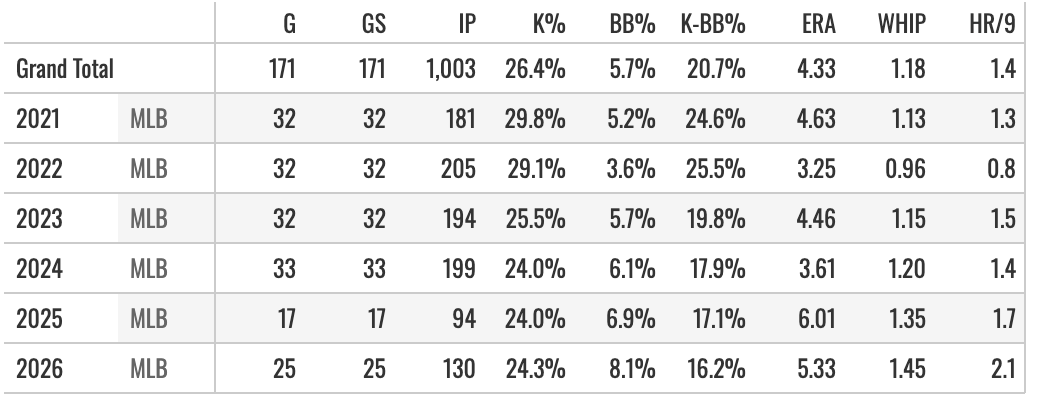
Good news: 16.2% K-BB%, 27.2% K% in his last 38 innings.
Bad news: While his HR/FB will drop, it’s unlikely to come down to a league-average mark.
Nola doesn’t have much other than his great curveball, so he’s a pretty easy guy to hit hard and far when you know what pitch is coming. But I like buying into Nola for the rest of this season.
Let’s flip it the other way around. Here are the K% “over-performers”. I put that in quotes because there are some guys that just have the knack for doing this. It’s not going to be a case where everybody regresses toward the same point.
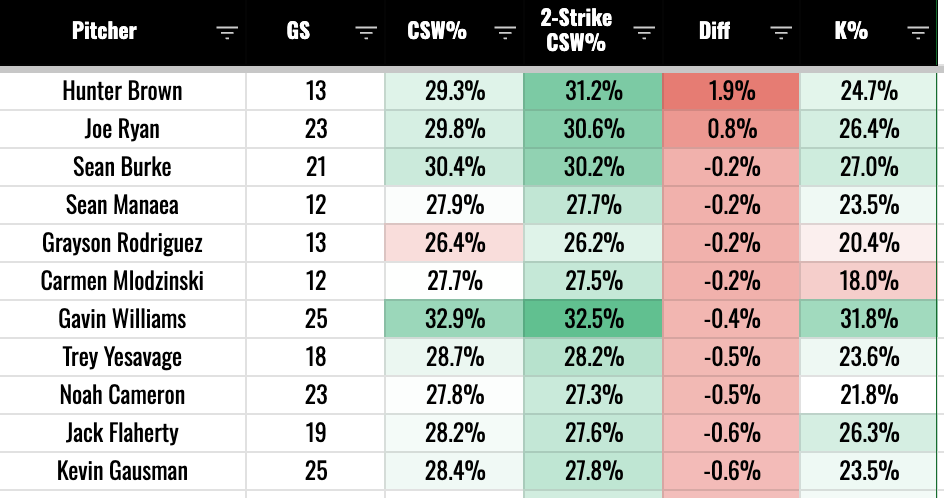
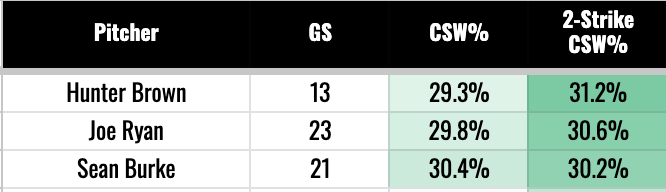
Not a surprise to see Hunter Brown here. He’s been like McLean in that he got a ton of strikeouts last year without many whiffs and a bunch of balls thrown early in counts. He seemed to have this weird ability last year to lock in when he needed to, get the strikes, and limit the balls when he needed to.
We’re seeing it again this year, as he’s the only guy in the league with a two-strike CSW% more than one point better than their overall. It’s a huge, huge difference. Doubling the gap of the #2 guy in Joe Ryan.
I don’t really like Hunter Brown for fantasy leagues the rest of the year. Not even for this reason, just the fact that he has a 13.7% BB%. But at least his all-counts CSW% is above average. He can still get some strikeouts, and if the command can come back to his normal, he’ll be fine.
Sean Burke is here, and that’s a bit of a red flag. He’s been tremendous at putting guys away. His SwStr% sits at 12.6%, a bit above the league average, but his K% is five points above the league average up there at 27%. Few, if anybody, saw this breakout season coming, and maybe some of it is explained by the luck of him just throwing his best pitches in two strike counts. We’ve seen a little bit of a slip-up lately too with two of his last three being pretty bad outings.
Gavin Williams is here. He has that natural regression due. I could have believed he’d be a 27% K% guy this year if he made a step forward in command. And he’s made a huge step forward in command, but his K% is up to 32% after being under 25% the first three years of his career. So that doesn’t make a lot of sense.
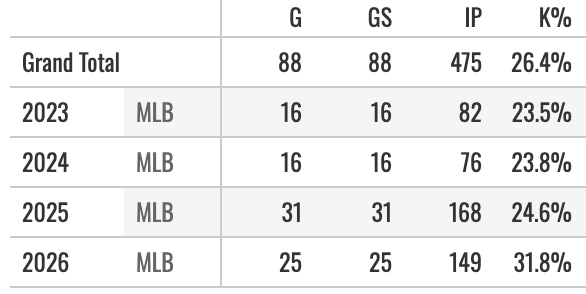
My bet would be he’s around that 27% mark for the final month+ of the season.
Another recent breakout is here - that’s Noah Cameron. He has a 27.8% CSW% overall but 27.3% in two-strike counts. He’s been great lately at putting guys away with that changeup. He freezes a lot of hitters. I don’t think it’s for real, though. He’s probably going to have a few more clunkers in there.
You can see that in his 3.96 JA ERA, which uses SwStr% as a major input. That’s a bad mark in that category, but his 22% K% is around the league average and his ERA is sparkling since mid-July.

Those are the main names I’m highlighting from this data. But as usual, I’m giving you the numbers to do whatever you please with.