


Trevor (@ffculater) hands out some high upside best bets for today’s MLB action. Subscribe or upgrade today to get loads of DFS and betting content and tools!
The O/U Model Is Cooking
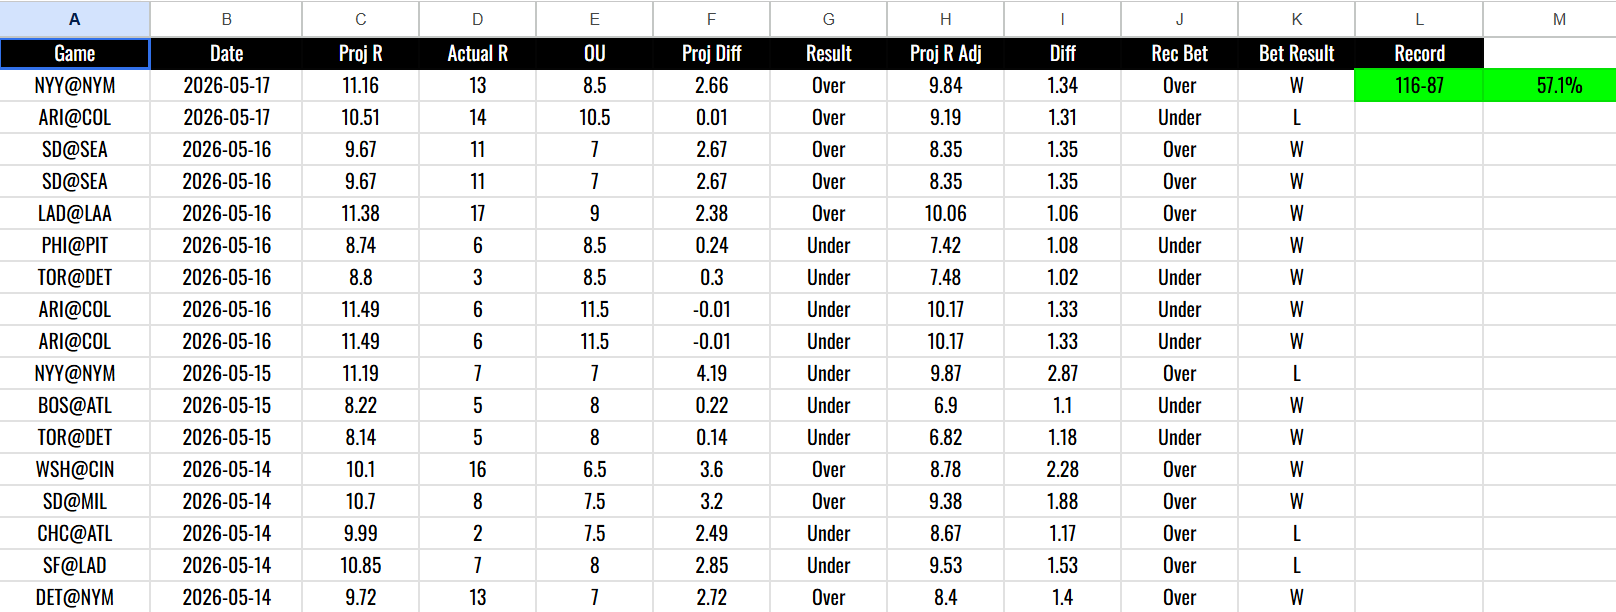
The over/under system just crossed 200 games and the receipts are real. 116 wins, 87 losses. A 57.1% win rate on totals plays through May 17.
For anyone who has actually bet baseball totals, you know that number matters. Breakeven sits around 52.4% once you account for the juice. Anything above that is profit. Sitting at 57.1% across more than 200 picks is not a hot streak. It is a track record.
The recent run has been ridiculous
Saturday, May 16. Seven plays, seven wins. Every single one cashed.
Two Padres vs Mariners overs. A Dodgers vs Angels over that landed at 17 runs against a 9 total. The Phillies vs Pirates under. Blue Jays vs Tigers under. And the Diamondbacks vs Rockies double dip in Coors Field that came in under against every gut instinct that tells you to play overs in Denver.
A perfect day in a sport where perfect days are not supposed to happen.
Sunday gave one back to go 1-1. Friday May 15 went 2-1. The only miss on Friday was the Yankees vs Mets under, where the model said under by 4.19 runs and the game still managed to land at 7. Sometimes the projection is right and the result is what it is.
Across the last four days of plays in the log, the system is 13-4. That is a 76% clip on a recent stretch where most public bettors are getting their teeth kicked in by chalk overs and weather games.
What that looks like in real money
Standard -110 juice. Bet to win, meaning you risk $11 to win $10, or $110 to win $100. Flat bet sizing, one play at a time.
$10 to win bettor: Up $203 through 203 games. Every win pockets $10. Every loss costs $11. Multiply that out across the record and you are sitting on a nice dinner.
$25 to win bettor: Up $507. Same math, bigger units. Risk $27.50 to win $25 per play. The middle ground for someone who wants real money on the line without sweating every game.
$100 to win bettor: Up $2,030. Risk $110 to win $100 per play. That is over two grand in profit on a hobby most people are losing money at.
Zoom in on the last four days alone. The 13-4 stretch added about $86 for the $10 bettor, $215 for the $25 bettor, and $860 for the $100 bettor. In less than a week.
The point is not the size of the bet. It is the slope. The line keeps going the right direction.
Why it works
The system runs a projection on total runs, then adjusts it, then compares the adjusted number to the posted total. The bigger the gap, the stronger the play.
Diamondbacks vs Rockies on May 16 is a clean example. Projected 11.49 runs. Adjusted down to 10.17. Posted at 11.5. The model said under by a hair. Final score finished at 6 total runs. Easy.
Washington vs Cincinnati on May 14 was the other direction. Projection nearly four runs over the posted total of 6.5. Game came in at 16. Print.
The takeaway
A 57.1% clip over 203 games is not variance. The sample is big enough that the edge is real, and the recent stretch is just the model catching fire on top of a foundation that has been there all season.
So today’s free play is brought to you by the O/U model. One of the things we love to do is fade the public. 74% of the money is on the over at 10.5 today and Shota has actually been very good this season. The model projects it for 9.17 runs on a 10.5 total so we’re going to put one unit at -105 on the under.
Mil vs CHC U 10.5 -105 1u