The SP Luck Post
Back to basics! We examine the luckiest and least lucky SPs from 2025 and talk about what that means for their 2026 draft stock
This is one of those boring but useful posts. You’ve gotta do it every year, because the basics are the basics for a reason. We’re looking at the pitchers most affected by variance last year. We call it “lucky” or “unlucky”, and those usually aren’t exactly the right words for it, but it comes close enough.
I say that because most luck stats are not entirely luck. There are things a skilled player can do to routinely turn in high or low values in the “luck” stats. You don’t expect the exact same average value for every skill level of player. But nonetheless, they are categories that you expect significant regression toward the mean over time. So we can spot the guys at the extremes and feel pretty good about them reverting next year. And that can be good or bad; we’ll cover both sides of it.
Let’s briefly talk about these three categories.
Category 1: RISP H%
This is a weird one because it’s my own doing. You can read about it here. And you can find other explanations for stats I’ve come up with in the knowledge base here.
This one is modeled after LOB% (Strand Rate). It’s the percentage of the pitcher’s hits allowed that they allowed while a runner was in scoring position. The league average is around 21%. The highest value last year (15 GS minimum) was Sandy Alcantara at 33%. The lowest was Trevor Rogers at 11%.
This one does give us a standard expectation across the board. We aren’t talking about the rate of allowing hits, we’re just looking at the hits that were allowed and seeing the rate of them that happened at the worst time. I’d expect 21% for every pitcher next year; I don’t see any skill being involved here.
Category 2: BABIP
I don’t think this one needs explaining! But maybe you don’t know the formula for it, so I’ll provide it:
BABIP = (Hits Allowed - HR Allowed) / (Balls In Play Allowed - HR Allowed)
Simply put, what percent of the balls in play you allowed (when removing homers) went for hits? League average is usually around .290. This is one that pitchers can control, though. Better pitchers generate weak contact, and that turns into reliably low BABIP. Tyler Glasnow was second this year in BABIP at .225. That’s really low. But it’s better to compare it to his career BABIP (.277) rather than the league average, because Glasnow is really tough to square up.
Category 3: HR/FB
Another well-known one. This is the percentage of your fly balls allowed that went for homers. Home ballpark matters quite a bit here; I’d say that’s the biggest predictor of this. You will allow a higher HR/FB in Cincinnati than you will in Kansas City.
The league average is around 16%. Park adds 3-5 points in either direction to that. So if you’re looking at a guy with a 25% HR/FB, they were unlucky. But context is pretty important to keep in mind there.
Note that the league average, if you’re looking at FanGraphs or maybe some other sites, will be different (lower, I believe). That’s because not all websites count fly balls the same. FanGraphs, I believe, counts infield fly balls as fly balls, while Baseball Savant does not count those as fly balls. You can see more about that here.
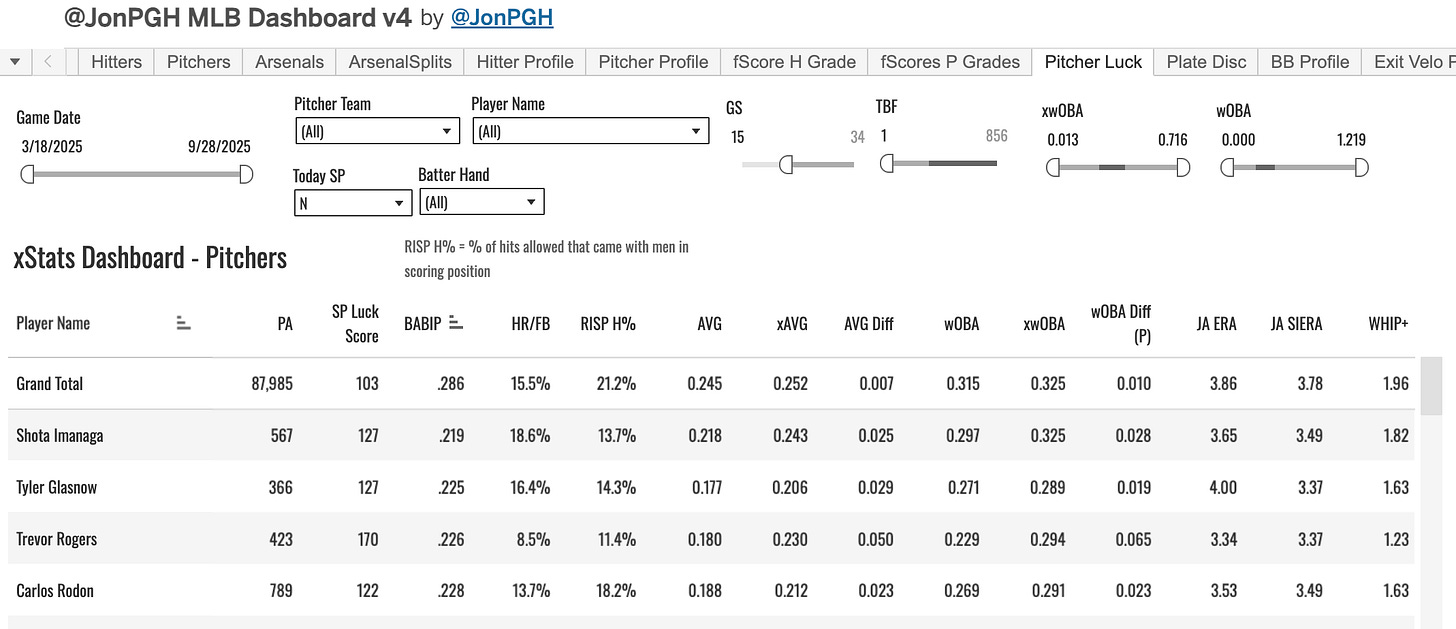
What I do then is weigh all those together evenly and give each pitcher a “Luck Score”. There’s a Google Sheet that tracks that here, and there’s also a nice tab called “Pitcher Luck” on the main dashboard where you can see all of this and more.
That’s enough setup, let’s get to the names and the numbers!
Good Luck Pitchers
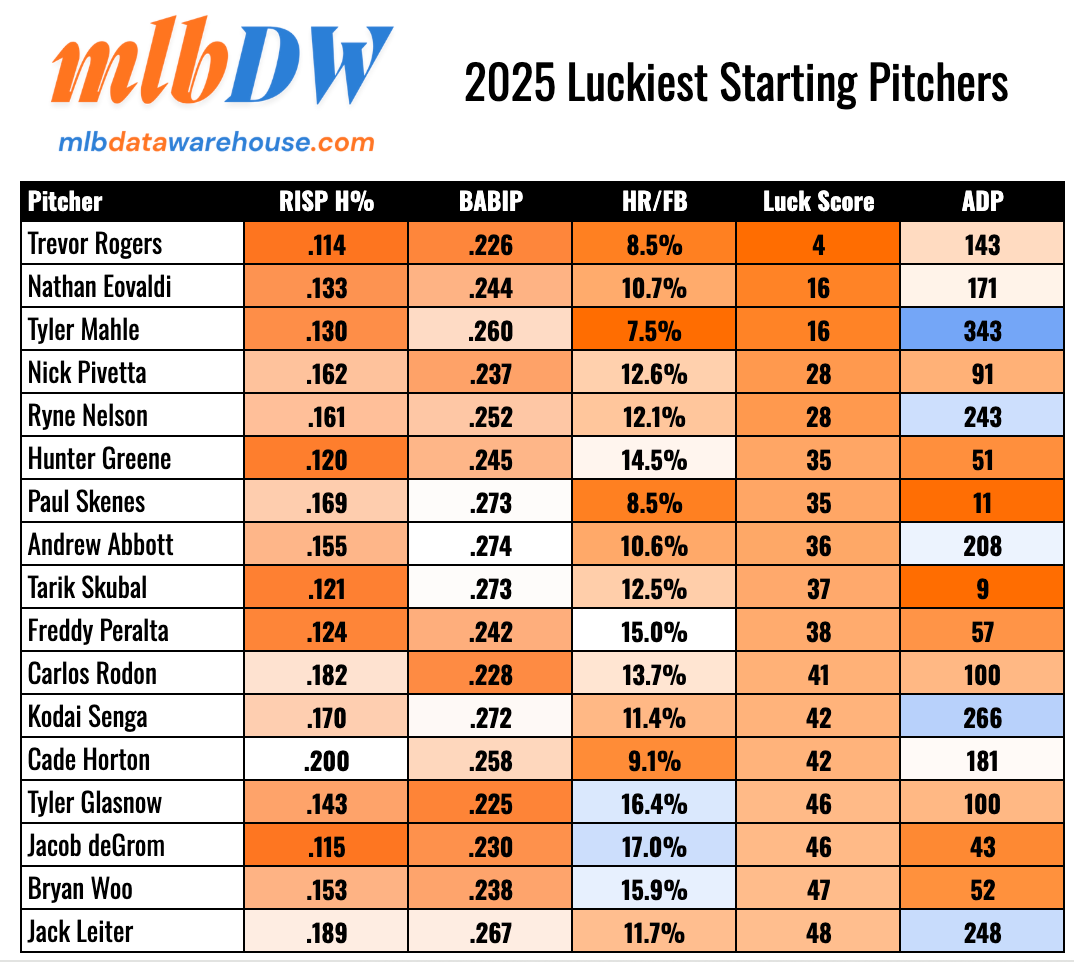
I’ve gotten rid of any pitcher that isn’t being drafted in the top 400 for 2026. Jack Kochanowicz was the least lucky pitcher in baseball last year by my scoring system, but he’s not a name we care about for fantasy purposes next year, so I’ve left him out.
I have 17 names to show you on this side of things!
Trevor Rogers
The poster boy! He did some sun-running last year in his surprise breakout season. Only 11.4% of his hits allowed came with runners in scoring position, he gave up a crazy low .226 BABIP, and his 8.6% HR/FB was 5-6 points lower than you’d reasonably expect. The guy finished with a sick 1.81 ERA in 109.2 innings. A few more starts to get him qualified, and he might have won the ERA crown. His SIERA was at 3.75, which says a lot. He’s around the #40 SP off the board in early drafts. Lots more will be said and studied about the guy this offseason, but I’m out on him at that price. I don’t think anybody understands the extent of his good fortune last year.
I could see Rogers having continued success in HR/FB. Lefties allow just a 14% HR/FB in Baltimore because of the deep fences in left-center field. He also has the elite changeup that is tough to time up. He keeps hitters off balance. So there are some things he does that generate the weak contact, but 8.5% is not happening again.
He was one of the luckiest pitchers in all three categories. BABIP and RISP H% are correlated a little bit, but they have nothing to do with HR/FB. It’s wild to be extremely fortunate across the board like that.
We see here that HR/FB is independent of the other two, but BABIP and RISP H% have a higher correlation since they both have to do with turning batted balls into outs.
The rest of this post is for paid subs only. Join today for $12/month or $85/year and get everything happening here at MLB DW for the 2026 season!


