

One thing I do every year is save off each major system's projections right before the season starts. Then we can use those to do some checking on the accuracy after the season concludes.
The systems surveyed:
- ATC - Ariel Cohen (https://x.com/ATCProjections)
- OOPSY - FanGraphs/Jordan Rosenblum (https://x.com/RosenJordanBlum)
- STEAMER (https://www.steamerprojections.com/)
- The Bat X - Derek Carty (https://x.com/DerekCarty)
- MLB Data Warehouse - Cha Boy
My season-long projections... it turns out they SUCK. I got pounded; clearly the worst. Do I have an excuse? Yes. I programmed them by myself three years ago during my six-week parental leave. So I was mostly jamming keys while watching that baby. I tried to improve them in years past, but apparently I didn't do a very good job! I could redo them, I could study the past years and use some of the AI tools to refine my methods. But why do that? Am I going to make something better than these other systems? Probably not! Would it be profitable? I don't think so! These other systems are very strong and will always be free.
So I'm just going to take the loss and not worry about trying to compete for now.
I'm not trying to go full AI-bro; I think the value of content these days comes from the human element. My general rule is to use AI to help with my tools and reports and to scrape non-opinion stuff like news updates. I'll never copy-paste player analysis from AI in here. When you're reading paragraphs on MLB DW, you can be confident they're written by a human being.
But checking projection accuracy is raw numbers. There's no opinion involved, no in-depth analysis needed; you can just give ChatGPT the numbers and have it do its thing. Computers are way better with numbers than humans are, so we'll use it here.
Caveat: There are different ways to check this.
This is not the definitive methodology or absolutely 100% the right answer. What I did was this:
- Look at all hitters with 300+ PA
- Look at all SPs with 100+ IP
- Look at all RPs with 100+ IP
Filter everybody else out. Then take those players, and use these categories to get the mean absolute error (MAE) for each, and then judge each system on that.
- Hitters
- R
- RBI
- HR
- SB
- AVG
- OPS
- Pitchers
- IP
- W
- SV
- ERA
- WHIP
- SO
- K/9
That's mostly just the standard 5x5 roto league, but an add-in with OPS and K/9.
We iterated through it a few different ways to crown the winner. The full details are below, not written by me. But here's the synopsis:
Overall Winner: ATC
Winner for Hitters: ATC
Winner for Pitchers: OOPSY
You could stop reading right there, I guess! If you want advice, there it is. Use ATC for hitters and OOPSY for pitchers.
One thing I think should be noted. OOPSY is the new guy on the block. Jordan and the FanGraphs guys are working hard on these. They're improving them and incorporating new stats where appropriate all the time. I wouldn't be surprised if they find a way to overcome ATC on both sides next year.
ATC also works differently, which I believe gives that system an advantage. It uses those other systems and aggregates based on past accuracy rather than projecting each player from their real-life results in the past.
ATC is a “smart” projection aggregation model. While most other aggregation systems typically apply equal weight to all underlying data sources, ATC assigns weights based on historical performance.
Source: https://fantasy.fangraphs.com/the-atc-volatility-metrics/
It's a great system, a great idea, and it works very well. But without the other systems, it could not exist.
Onto the full AI-written report for those of you who are interested.
Which MLB Projection System Was Best in 2026?
ATC was the best overall projection system in this comparison. It also finished first for hitters. OOPSY was the best for pitchers, winning both the starting pitcher and reliever comparisons.
That makes ATC my starting point for 2027, with OOPSY providing a useful second opinion on pitchers.
But this was a close competition. The BAT finished second overall, and changing the player sample changed the winner in one of the checks. There’s enough here to establish a preference, but not enough to declare that one system has solved baseball.
Here’s how OOPSY, ATC, The BAT, JA, and STEAMER compared with the supplied 2026 results.
The Overall Results
The main comparison includes:
- Hitters: At least 300 actual plate appearances.
- Starting pitchers: At least 100 actual innings.
- Relievers: At least 40 actual innings.
- Coverage: Every player had to appear in all five projection systems.
A pitcher counted as a starter if at least half his actual appearances were starts.
That left 251 hitters, 113 starters, and 165 relievers.
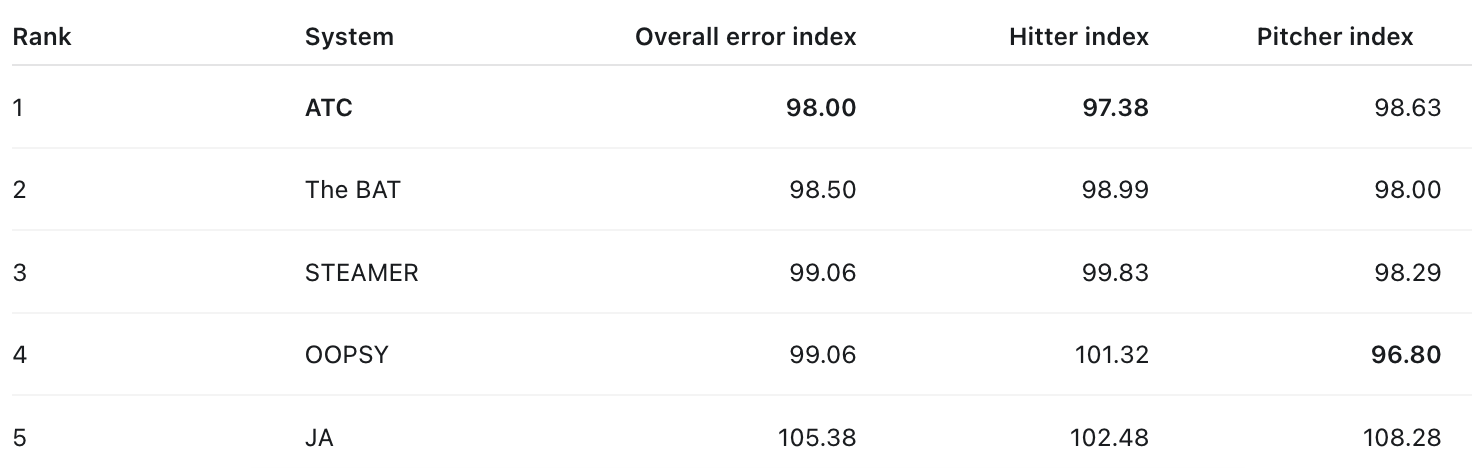
Lower is better. An index of 100 represents the average error of these five systems. It is not an accuracy percentage.
STEAMER and OOPSY are effectively tied overall. Their unrounded scores are 99.0584 and 99.0612.
ATC’s lead over The BAT amounts to approximately 0.5% less normalized error. That’s a win, but it’s a small one.
Hitters: ATC Takes First
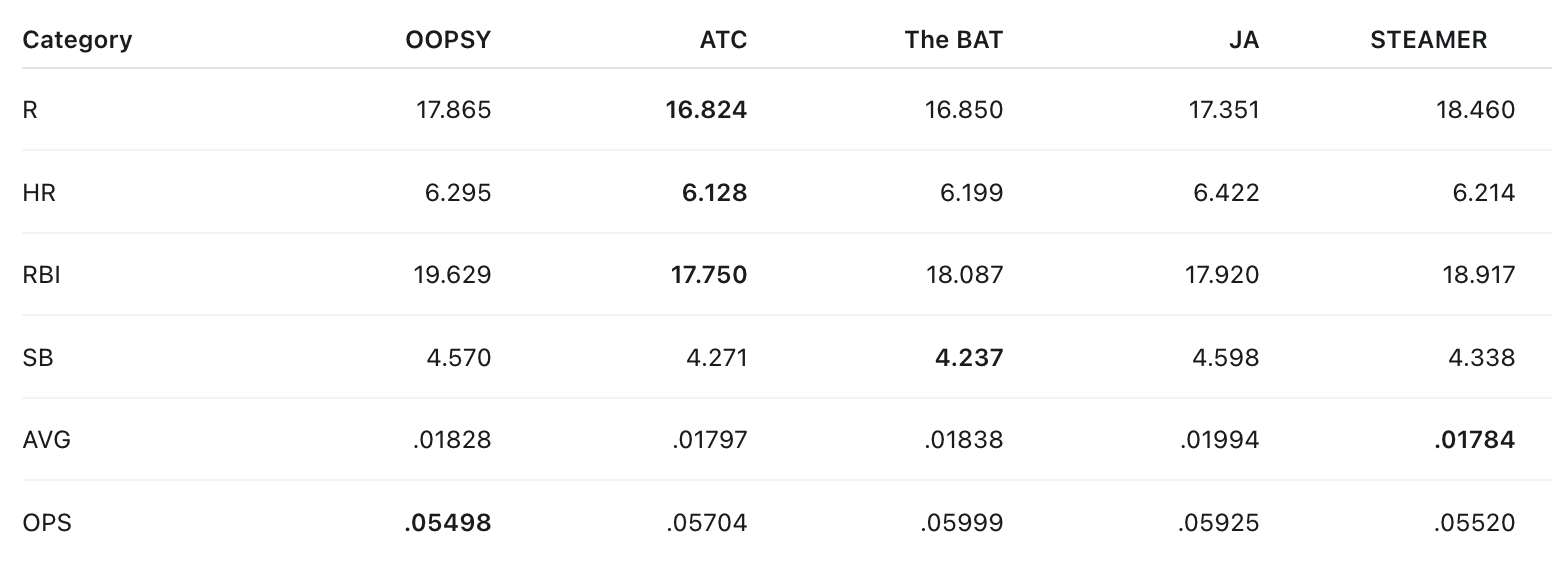
ATC won three of the six hitting categories: runs, home runs, and RBI. It also stayed competitive in batting average and stolen bases, giving it the best combined hitter score.
The BAT finished second, followed by STEAMER, OOPSY, and JA.
Here is each system’s mean absolute error, or MAE. This measures the average size of its player-level miss, regardless of direction.
Runs: ATC
ATC averaged 16.824 runs of error per hitter, barely beating The BAT’s 16.850. That difference is effectively negligible for practical purposes.
Home Runs: ATC
ATC’s average miss was 6.128 home runs, compared with 6.199 for The BAT.
ATC wins, but the typical miss for both systems was still roughly six home runs per player. That’s a useful reminder of the uncertainty surrounding any individual projection.
RBI: ATC
ATC averaged 17.750 RBI of error, with JA second at 17.920.
JA’s second-place finish here was its strongest category result under the requested cutoffs.
Stolen Bases: The BAT
The BAT averaged 4.237 steals of error, narrowly beating ATC’s 4.271.
The difference is small relative to the typical miss of more than four steals per hitter.
Batting Average: STEAMER
STEAMER’s average error was .01784, or about 17.8 batting-average points. ATC finished second at approximately 18.0 points.
OPS: OOPSY
OOPSY averaged .05498 OPS of error, narrowly beating STEAMER’s .05520.
OOPSY’s OPS win didn’t overcome its larger counting-stat errors in the combined hitter comparison.
Pitchers: OOPSY Wins
OOPSY finished first in the combined pitcher comparison, ahead of The BAT, STEAMER, ATC, and JA.
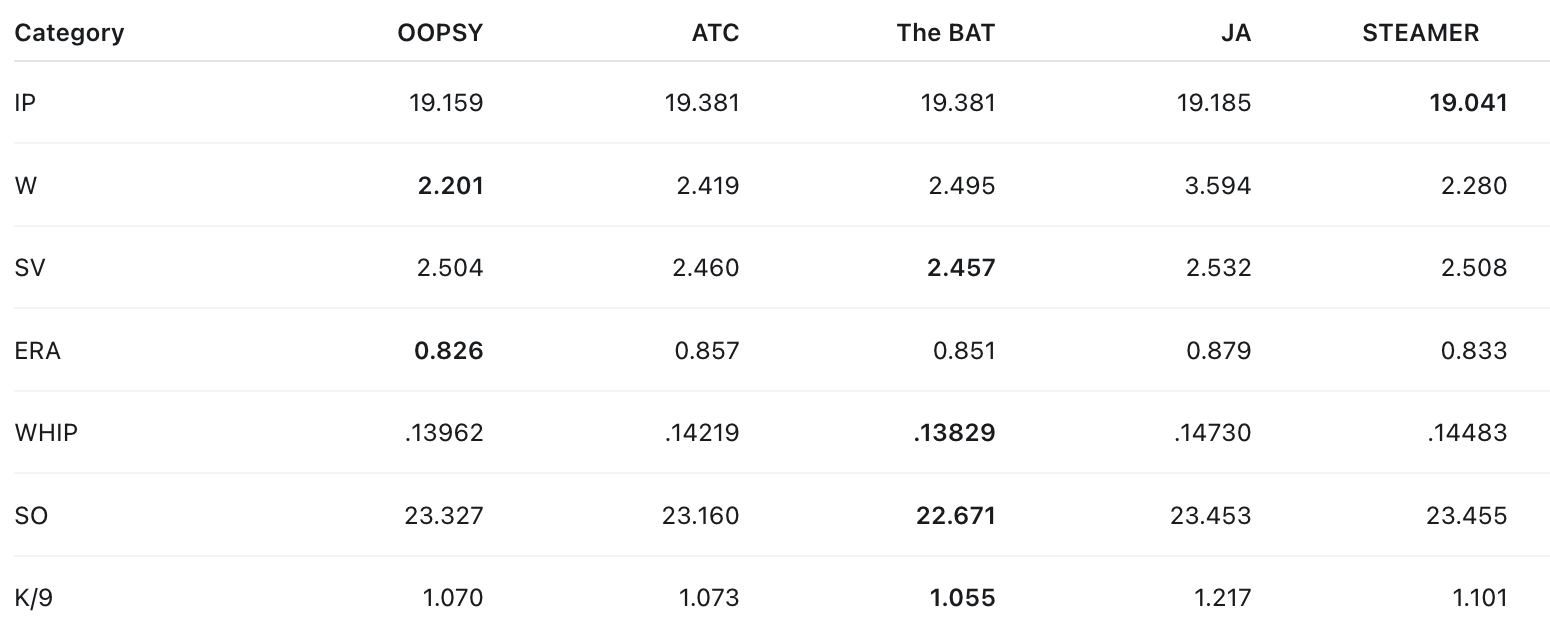
Its advantages in wins and ERA outweighed The BAT’s category wins in saves, WHIP, strikeouts, and K/9.
That distinction matters: the overall score measures the size of the errors across categories, rather than simply counting category victories.
Innings: STEAMER
STEAMER averaged 19.041 innings of error, narrowly beating OOPSY’s 19.159.
Actual innings were converted from baseball notation before scoring: 45.2 innings means 45⅔, not 45.2 decimal innings. Projected innings remained in decimal form as supplied.
Wins: OOPSY
OOPSY averaged 2.201 wins of error, ahead of STEAMER’s 2.280.
JA’s average error was 3.594 wins, its largest relative weakness in the pitching comparison.
Saves: The BAT—with a qualification
The BAT won across the full pitcher sample, averaging 2.457 saves of error. ATC was virtually tied at 2.460.
However, many pitchers aren’t save candidates. Restricting the comparison to the 45 eligible pitchers projected for at least five saves by any system put ATC first:
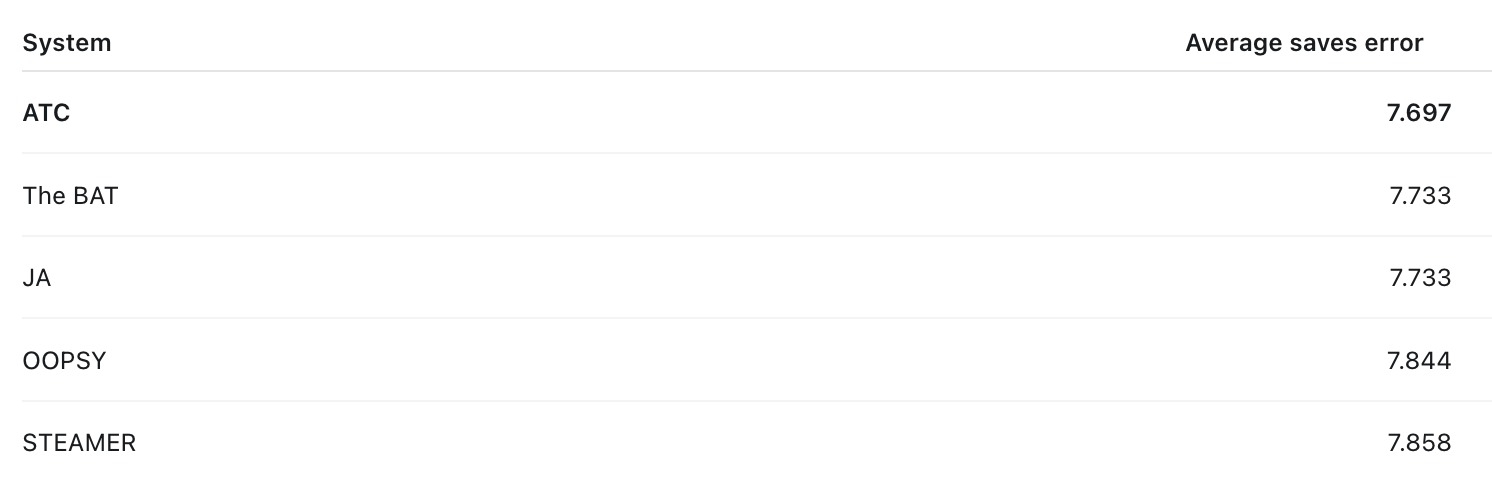
For closer decisions, that subset is more relevant than an all-pitcher saves score. It still shows very little separation.
ERA: OOPSY
OOPSY averaged 0.826 ERA of error, beating STEAMER’s 0.833.
WHIP: The BAT
The BAT averaged .13829 WHIP of error, with OOPSY second at .13962.
Strikeouts: The BAT
The BAT averaged 22.671 strikeouts of error, compared with ATC’s 23.160—a reduction of approximately 2.1%.
K/9: The BAT
The BAT averaged 1.055 K/9 of error, narrowly ahead of OOPSY’s 1.070.
Starters and Relievers Tell the Same Story
OOPSY also finished first when starters and relievers were evaluated separately.
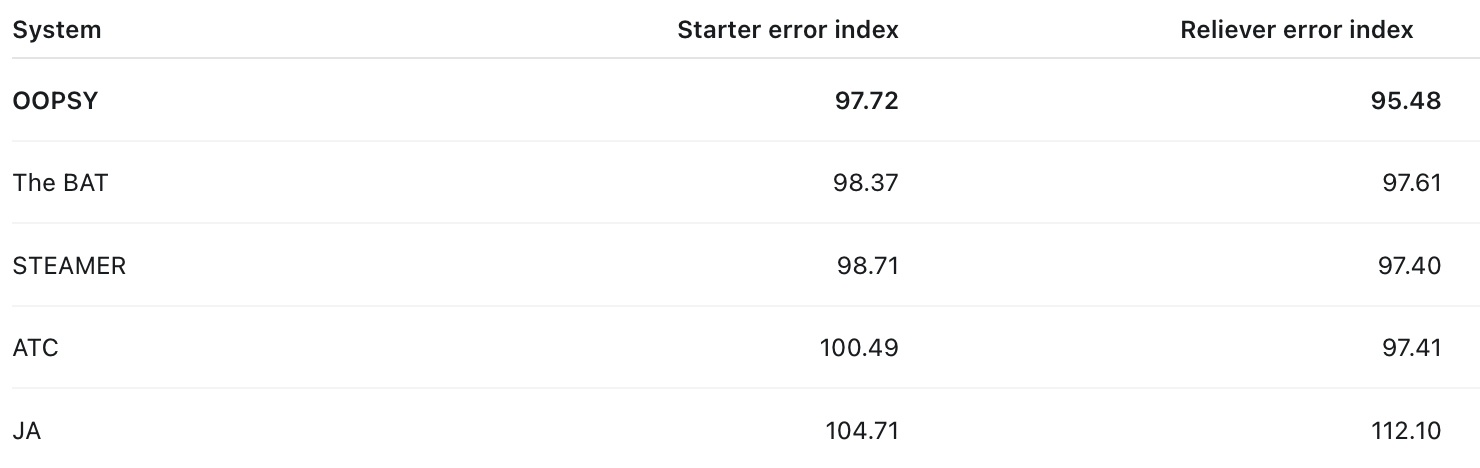
These indexes use separate benchmarks for each role, so they should be compared within columns.
The headline pitcher score pools all eligible pitchers and gives each player equal weight. It does not give starters and relievers equal halves of the pitching score.
How the Scoring Works
First, calculate each player’s miss:
Error = projected result − actual result
Then take the absolute value so overprojections and underprojections don’t cancel.
For example, ATC projected Adley Rutschman for 16.8307 home runs, while the actual-results file has 13. His absolute error was therefore 3.8307 home runs.
Repeat that for every eligible hitter and calculate the average:
MAE = sum of absolute player errors ÷ number of players
But we can’t directly average six home runs of error with .018 of batting-average error. They use different units.
To combine categories, each system’s error is divided by the average error of all five systems in that category:
Category error index = 100 × system MAE ÷ five-system average MAE
Finally:
Hitter index = average of the six hitter category indexes
Pitcher index = average of the seven pitcher category indexes
Overall index = (hitter index + pitcher index) ÷ 2
This gives hitting and pitching equal overall weight.
How Much Should We Trust the Winner?
ATC won most of the alternative checks, including a scoring method that penalizes large misses more heavily and an approach giving all 13 categories equal weight.
But the winner wasn’t universal.
- Including every common player with MLB playing time: The BAT won overall.
- Adjusting counting stats to actual playing time: STEAMER won. This uses hindsight playing time, so it’s a diagnostic of production rates rather than a usable preseason forecast.
- Using only rate categories: OOPSY won the combined comparison.
- Using only counting categories: ATC won.
I also ran 5,000 paired bootstrap resamples, repeatedly sampling players while keeping their five-system forecasts together.
ATC finished first in 66.88% of those resamples. The BAT won 18.30%, OOPSY 8.52%, and STEAMER 6.30%.
Those aren’t probabilities of winning in 2027. They measure how stable this result is when resampling the players from this season.
The uncertainty interval around ATC’s lead over The BAT included zero. The evidence favors ATC, but it doesn’t establish a decisive advantage.
What I’m Taking Into 2027
ATC is my default choice from this comparison. It won overall, led hitters, and stayed first through most of the alternative scoring checks.
OOPSY gets the strongest endorsement for pitchers. It led both starters and relievers, with particular strengths in wins and ERA.
The BAT remains a useful second opinion, especially for strikeouts and WHIP. It also won the broadest common-player comparison overall.
The limitations matter. This grades the supplied projection files against the supplied actual-results files for one season. Requiring actual playing-time minimums excludes many injured or inactive players, and requiring all five forecasts leaves some rookies and other uncovered players outside the comparison. It’s a projection-error study, not a test of auction values or draft profitability.
The useful takeaway is a hierarchy of starting points: ATC overall, OOPSY for pitchers, and The BAT as a close alternative. The gaps are small enough that disagreements between those systems deserve attention.


